Are you ready to take your social media game to the next level? Understanding engagement rate could be your golden ticket! In today’s digital landscape, simply amassing followers isn’t enough; what truly matters is how those followers interact with your content. Engagement rate is the magic number that tells you just how well you’re connecting with your audience. But don’t worry if the concept feels a bit overwhelming—calculating engagement rate doesn’t have to be complicated. In this step-by-step guide, we’ll break it down into bite-sized pieces, making it easy for you to measure your success and refine your strategy. By the end, you’ll not only know how to crunch the numbers, but you’ll also understand why engagement rate is a crucial metric for smarter, data-driven decisions. So, let’s dive in and unlock the secrets to maximizing your online impact!
Understanding Engagement Rate and Its Importance
Engagement rate is a critical metric that helps you understand how your audience interacts with your content. It goes beyond mere likes or shares; it measures the quality of the relationship between your brand and its followers. By analyzing this rate, you can gain insights into what resonates with your audience and what doesn’t, allowing you to tailor your strategies accordingly.
To put it simply, a high engagement rate signifies that your content is effectively capturing attention and fostering interaction. This can lead to increased brand loyalty, higher conversion rates, and ultimately, a stronger bottom line. On the other hand, a low engagement rate may indicate that your content is falling flat or that your audience isn’t connecting with your messaging.
There are several components that contribute to an effective engagement rate:
Likes: A quick indication that people appreciate your content.
Shares: When users share your content, it reflects their belief that it has value.
Comments: Engaging in dialogue shows that your audience is invested in the topic.
Clicks: Whether they’re clicking on a link, a call-to-action, or any other element, this shows interest.
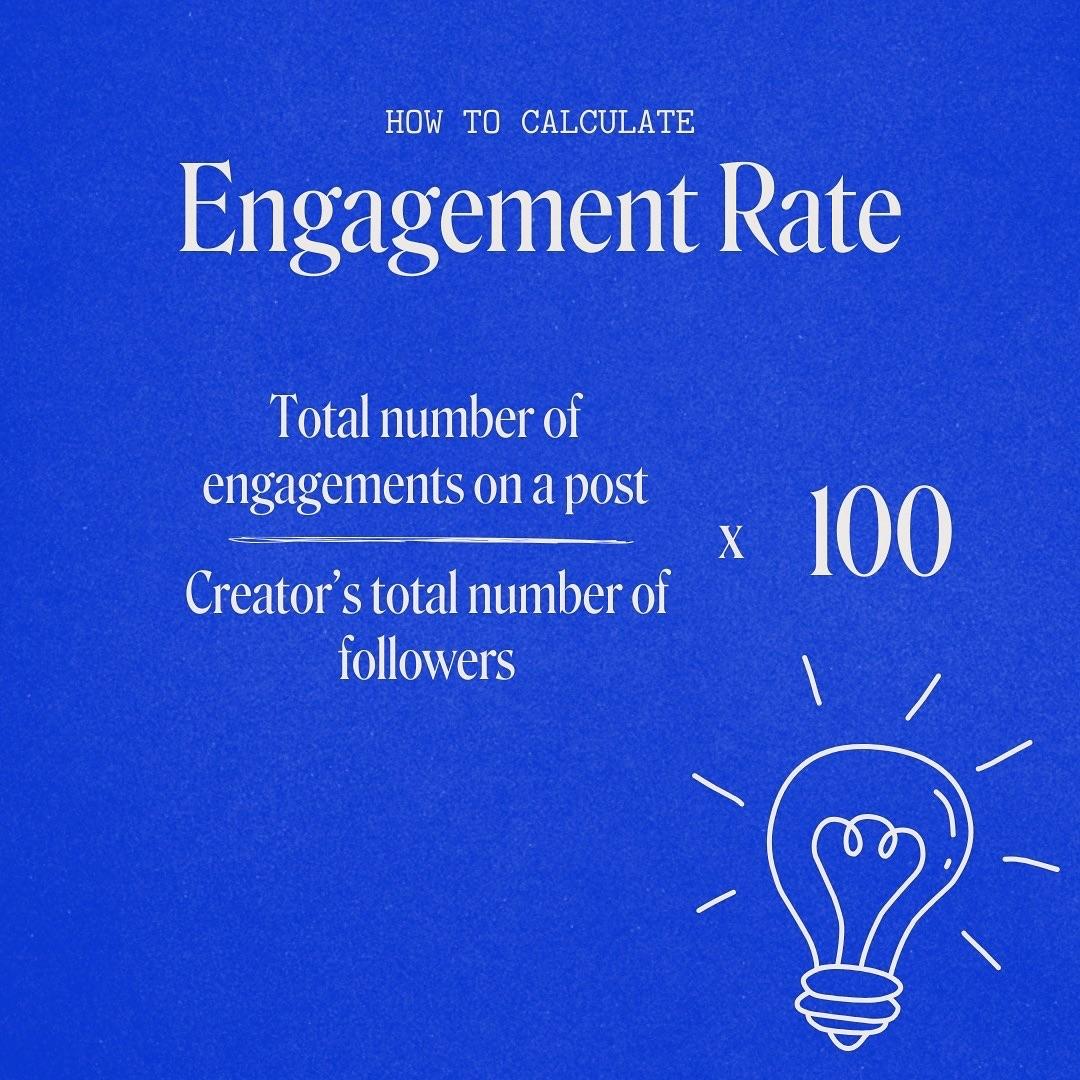
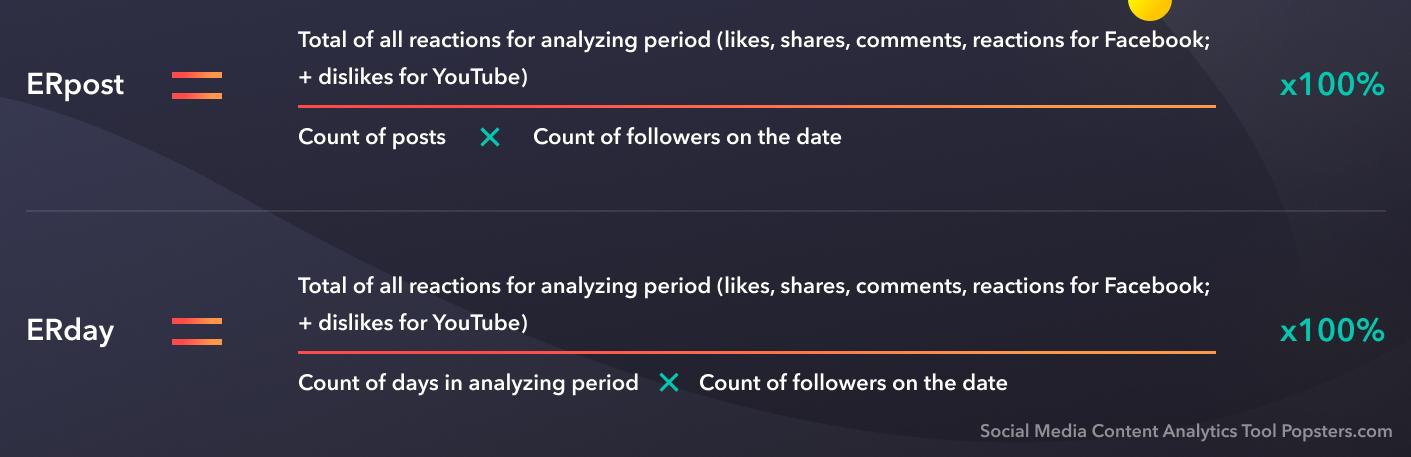
To calculate your engagement rate accurately, you can use the following formula:
Total Engagements
Total Followers
Engagement Rate (%)
100
1000
10%
200
1500
13.33%
150
1200
12.5%
As shown in the table above, the engagement rate is calculated by dividing total engagements (likes, shares, comments, clicks) by total followers and multiplying by 100. This gives you a percentage that reflects how engaged your audience is with your content.
Understanding engagement rate is essential for creating a successful social media strategy. It enables you to:
Identify Trends: Discover what types of content are most engaging.
Optimize Content: Tailor your future posts based on audience preferences.
Measure Success: Track progress over time and adjust strategies as needed.
Ultimately, engagement rate acts as a compass for your content strategy. It guides you toward what works, helps you refine your approach, and allows you to build a more engaged community around your brand. Investing time in understanding this metric can lead to smarter decisions and better outcomes.
The Key Components of Engagement Rate Explained
Understanding engagement rate is essential for marketers and content creators who want to measure the effectiveness of their strategies. Engagement rate combines various actions taken by your audience, providing a holistic view of how well your content resonates. Think of it as a gauge for audience interaction, reflecting both the quantity and quality of engagement.
At its core, the engagement rate is calculated by comparing the total engagement actions to the total number of followers or impressions. This means that every like, comment, share, and click counts towards the overall engagement score. However, the definition of engagement can vary across platforms, making it crucial to tailor your calculations to the specific audience behavior you’re analyzing.
Here are the key components that contribute to engagement rate:
Likes: Simple yet powerful, likes indicate that your content resonates with your audience.
Comments: These offer deeper insights, as they reflect a willingness to engage in conversation and share opinions.
Shares: When your audience shares your content, it signals that they find it valuable and want to spread the message.
Clicks: Click-throughs to your website or other resources demonstrate interest and intent to learn more.
Followers: The total number of followers or subscribers can contextualize your engagement rate, helping to assess performance against audience size.
To illustrate how these components come together, consider this simple table:
Engagement Type
Count
Likes
150
Comments
30
Shares
20
Clicks
50
In this example, you would add up all engagement counts, resulting in a total engagement of 250. If your post had 1000 followers, the engagement rate would be calculated as follows:
Engagement Rate = (Total Engagements / Total Followers) x 100
Engagement Rate = (250 / 1000) x 100 = 25%
With this engagement rate, you can assess how effectively you’re connecting with your audience. A higher engagement rate often indicates that your content is relevant, interesting, and valuable to your followers. Conversely, a lower rate may suggest a need for content reevaluation or a shift in strategy.
Ultimately, tracking engagement rate over time allows you to identify trends, measure the impact of changes, and refine your content strategy, ensuring you stay aligned with your audience’s preferences.
Choosing the Right Metrics for Your Brand
When it comes to measuring your brand’s success, the right metrics can make all the difference. Choosing metrics that align with your goals not only helps you gauge performance but also aids in refining your strategies. If you want to enhance your brand’s presence, start by focusing on the following key metrics:
Engagement Rate: This metric reflects how actively your audience is interacting with your content. It’s calculated by dividing the total engagement (likes, comments, shares) by the total reach or impressions and multiplying by 100.
Reach: Understanding how many unique users see your content can help you assess overall visibility. This metric is crucial for brand awareness and can be tracked across various platforms.
Impressions: While reach counts unique views, impressions measure the total times your content has been displayed. This indicates potential visibility and frequency.
Follower Growth Rate: Monitoring how quickly your follower count grows can provide insights into how effective your content strategies are in attracting new audiences.
Click-Through Rate (CTR): This measures how often people click on your links compared to how many times they saw the content. A high CTR indicates that your audience finds your content compelling.
To get a clear picture of your brand’s performance, it’s essential to regularly analyze these metrics. Create a table to help visualize your data, which can facilitate easier comparisons and trend spotting:
Metric
Current Value
Last Month Value
Change (%)
Engagement Rate
4.5%
3.8%
+18.4%
Reach
10,000
8,500
+17.6%
Follower Growth Rate
300
250
+20%
As you delve deeper into your analytics, remember that context is key. A high engagement rate might signify that your content resonates well with your audience, but it’s equally important to consider the quality of interactions. Are followers genuinely interested in your brand, or are they just clicking for a moment?
Lastly, don’t forget to adjust your metrics as your brand evolves. What works today might not be relevant tomorrow. Stay agile and responsive to changes in audience behavior and platform algorithms. By regularly revisiting and refining your chosen metrics, you can ensure that your brand remains at the forefront of your industry.
How to Gather the Data You Need
Gathering the right data is essential for calculating your engagement rate accurately. Without a solid foundation of information, your metrics may not reflect the true performance of your content. Here’s how to effectively collect the data you need.
First, identify the platforms you want to analyze. Different social media platforms have their own unique metrics and audience behaviors, so be sure to focus on the ones that matter most for your brand. Consider including:
Facebook
Instagram
Twitter
LinkedIn
Pinterest
Next, determine the specific metrics you want to track. Engagement can take many forms, so it’s crucial to define what success looks like for you. Here are some key metrics to consider:
Likes
Shares
Comments
Click-through rates
Follower growth
Once you have your platforms and metrics sorted, it’s time to collect the data. Utilize the following tools and methods to streamline the process:
Native Analytics: Most social media platforms offer built-in analytics tools that provide insights into your posts’ performance.
Third-Party Tools: Tools like Hootsuite, Sprout Social, and Buffer can aggregate data across platforms for a comprehensive view.
Manual Tracking: If you prefer a hands-on approach, create a simple spreadsheet to log your engagement metrics regularly.
To visualize your data more effectively, consider compiling your findings into a clear table. Here’s a simple format you can use:
Platform
Total Engagements
Total Impressions
Engagement Rate
Facebook
500
2000
25%
Instagram
700
3500
20%
Twitter
300
1500
20%
remember to analyze the data you’ve gathered regularly. This will help you identify trends, understand audience preferences, and adapt your content strategy accordingly. By consistently monitoring your engagement metrics, you can refine your approach and drive better results in the long run.
Breaking Down the Formula for Engagement Rate
Understanding engagement rate is more than just crunching numbers; it’s about grasping the heart of your audience’s interaction with your content. At its core, engagement rate measures how effectively your audience is interacting with your posts. Whether you’re a seasoned marketer or a small business owner, knowing how to calculate this metric can transform your digital strategy.
To calculate engagement rate, start by gathering data on your total interactions. This includes:
Likes: The simplest form of engagement, indicating approval.
Comments: Providing insights into audience sentiment and feedback.
Shares: This shows your content’s potential to reach a wider audience.
Clicks: Valuable for understanding interest in your links or calls to action.
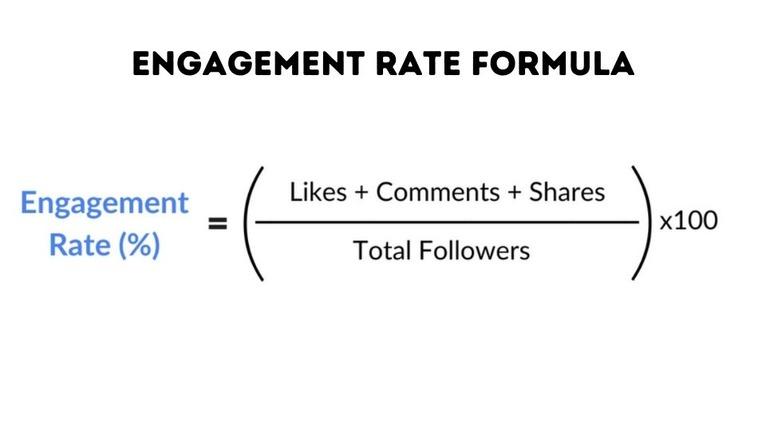
Once you have this information, the formula to determine your engagement rate is straightforward:
Engagement Rate (%) = (Total Interactions / Total Followers) x 100
For example, imagine you posted a stunning graphic that garnered the following:
Type of Interaction
Count
Likes
300
Comments
50
Shares
25
Clicks
100
In this scenario, your total interactions would be 300 + 50 + 25 + 100 = 475. If you have 1,000 followers, the calculation would be:
Engagement Rate = (475 / 1000) x 100 = 47.5%
This figure—47.5%—illustrates how engaging your content is relative to your follower count. A higher engagement rate often indicates that your content resonates well with your audience, while a lower rate signals a need for adjustment.
It’s important to note that this metric can vary significantly depending on the platform. For instance, engagement rates on Instagram are typically higher than those on LinkedIn. Therefore, when analyzing your rates, always compare against industry benchmarks and consider the unique characteristics of each platform.
calculating engagement rate is just the beginning. Use this metric as a launching pad to experiment with content types, posting times, and even audience segmentation. Monitoring these changes will help you continually refine your strategy and foster a deeper connection with your audience.
Interpreting Your Engagement Rate Results
Understanding your engagement rate is crucial for evaluating how well your content resonates with your audience. It’s not just a number; it’s a window into your audience’s interests and behaviors. A high engagement rate typically indicates that your followers find value in your content, while a low rate can signal the need for adjustment in strategy.
To interpret your engagement rate effectively, consider the following aspects:
Benchmarking: Compare your engagement rate against industry standards. Knowing where you stand allows you to gauge your performance relative to competitors.
Content Type: Different types of content yield varying engagement levels. Videos may perform better than static posts, so analyze which formats work best for your audience.
Audience Growth: A rising follower count can dilute your engagement rate. Monitor changes over time to see if engagement keeps pace with growth.
Post Timing: Experiment with when you publish your content. Engagement can fluctuate based on the day of the week or time of day, so track these metrics to find your sweet spot.
Another key element to consider is the quality of engagement. Not all interactions are created equal. Comments and shares generally indicate a deeper connection than likes. Diving into the types of engagement can provide insights into what resonates most with your audience.
It’s also essential to watch for trends over time. A sudden spike or drop in your engagement rate can indicate a need for immediate action. Analyze what changes coincided with these fluctuations. Did you launch a new campaign? Did a post go viral? Understanding these dynamics can lead to smarter content decisions moving forward.
When interpreting your results, don’t forget about context. Seasonal events, holidays, or even industry trends can impact engagement rates. For instance, a holiday-themed post may get more interaction during the festive season than at other times of the year. Keeping these contextual factors in mind will provide a clearer picture of your performance.
Lastly, consider creating a simple table to track your engagement metrics over time. This can help visualize trends and make it easier to spot fluctuations in your engagement rate.
Month
Engagement Rate (%)
Notes
January
3.5
New Year campaign launched
February
4.0
Valentine’s Day promotions
March
2.8
Content fatigue observed
Setting Realistic Benchmarks for Your Industry
is crucial for accurately measuring your engagement rate. Without these benchmarks, your metrics can become distorted, leading to misguided strategies. As you dive into calculations, consider what defines success in your specific niche.
Start by assessing your current performance metrics. Gather data on your engagement levels, including likes, shares, comments, and click-through rates, from various platforms. By evaluating your historical data, you can identify patterns and trends that will serve as a foundation for your benchmarks. Here are some key areas to focus on:
Industry Standards: Research average engagement rates within your sector. Industry reports and studies can provide insight into what your competitors are achieving.
Platform Specifics: Different social media platforms have distinct norms. For example, Instagram engagement rates often differ from those on Facebook, so tailor your benchmarks accordingly.
Your Audience: Understand your target audience’s behavior. Their preferences will influence what constitutes a good engagement rate for your brand.
Once you have a solid understanding of your current metrics and industry standards, it’s time to set those benchmarks. Aim for goals that challenge your team while remaining achievable. Here’s a useful framework for establishing your benchmarks:
Metric
Current Rate
Benchmark Goal
Likes per post
150
200
Comments per post
20
30
Shares per post
10
15
Regularly reviewing and adjusting these benchmarks is essential. As your audience grows and changes, so will your engagement expectations. Implement monthly or quarterly reviews to analyze your performance against these benchmarks. This not only keeps your strategy agile but also allows you to celebrate successes and recalibrate areas needing improvement.
Lastly, encourage collaboration within your team while setting these benchmarks. Engage with your content creators, marketers, and analysts to gather diverse perspectives on what realistic goals should be. This collective approach fosters accountability and increases the likelihood of achieving those targets, helping everyone feel invested in the process.
Using Engagement Rate to Drive Better Content Strategies
Understanding engagement rate is essential for shaping content strategies that resonate with your audience. It’s not just a number; it’s a powerful indicator of how well your content is connecting with readers. By focusing on the engagement rate, you can refine your approach to create more compelling content that drives interaction and fosters community.
To leverage engagement rate effectively, start by considering the various ways your audience interacts with your content. These can include:
Likes: A straightforward indication of approval.
Shares: When users find your content valuable enough to share with their own networks.
Comments: These provide direct feedback and foster discussions.
Clicks: Tracking how often users click on links or CTAs informs you about interest levels.
Once you have gathered data on these interactions, calculating your engagement rate is the next step. A simple formula can guide you:
Total Engagements
Total Reach
Engagement Rate Formula
Likes + Shares + Comments + Clicks
Number of unique users who saw your content
(Total Engagements / Total Reach) x 100
This formula helps you quantify how effectively your content engages its audience. A higher engagement rate suggests that your content resonates well, while a lower rate may indicate the need for adjustments. Use this metric to evaluate different types of content and understand what works best for your audience.
But calculating engagement rate is just the beginning. To truly utilize this metric, you should:
Analyze Trends: Keep track of engagement rates over time to identify patterns.
Segment Your Audience: Different demographics may engage differently; tailor content to suit their preferences.
Test Content Variations: A/B testing can reveal which formats or topics generate the most engagement.
Solicit Feedback: Don’t hesitate to ask your audience what they want to see more of.
Incorporating these insights into your content strategy allows for a more targeted approach. For example, if video content consistently yields a higher engagement rate compared to articles, consider shifting more resources to video production. Similarly, if certain topics generate more interaction, prioritize them in your content calendar.
Remember, the goal is to create meaningful connections. Engagement rate isn’t just a metric; it’s a reflection of your audience’s interest and investment in your content. By actively using engagement rate to inform your decisions, you not only enhance your content strategy but also build a loyal community around your brand.
Engagement Rate vs Other Metrics: What You Need to Know
When evaluating the performance of your content on social media or other platforms, understanding engagement rate is crucial. This metric provides insights into how well your audience is interacting with your posts, but it’s essential to compare it with other metrics to gain a comprehensive view of your content’s effectiveness.
First, let’s consider reach. While engagement rate reflects how many people interacted with your content, reach tells you how many unique users saw it. A high engagement rate with a low reach might indicate that your content resonates well with a small audience, but it could also suggest that your overall visibility is lacking. To enhance your strategy, aim for content that not only engages but also reaches a wider audience.
Next, we have impressions, which refer to the total number of times your content was displayed. This figure can sometimes inflate the perception of engagement rates. For example, if a post has high impressions but low engagement, it might indicate that while many users saw the content, few found it compelling enough to interact with. Balancing these metrics can help you refine your content strategy for better results.
Another key metric to consider is conversion rate. This metric measures the percentage of users who take a desired action, such as signing up for a newsletter or making a purchase. A high engagement rate doesn’t always translate to high conversion rates, particularly if the content isn’t aligned with your audience’s needs or your business goals. Using engagement data to inform your conversion strategies can lead to more effective campaigns.
To illustrate this, take a look at the following table:
Metric
Definition
Importance
Engagement Rate
Interactions (likes, comments, shares) relative to reach
Shows content resonance
Reach
Unique users who see the content
Indicates visibility
Impressions
Total times the content is displayed
Measures exposure
Conversion Rate
Percentage of users completing a desired action
Assesses effectiveness
Lastly, consider click-through rates (CTR), particularly if your goal involves driving traffic to a website. CTR tells you how many users clicked on a link in your content compared to how many people viewed that content. If a post has a high engagement rate but a low CTR, it could indicate that while the content is engaging, it may not be motivating users to take further action. Understanding this dynamic can help you tweak your calls-to-action and improve overall performance.
while engagement rate is a vital metric, it shouldn’t be viewed in isolation. By analyzing how it interacts with reach, impressions, conversion rates, and click-through rates, you can develop a more nuanced understanding of your content’s performance. This holistic approach will empower you to create more effective and resonant content that not only engages but also drives results.
Tips for Boosting Your Engagement Rate Effectively
Boosting your engagement rate is essential for thriving in the crowded digital landscape. Here are some actionable tips to help you enhance your interaction with your audience:
Know Your Audience: Start by understanding who your audience is. Use analytics tools to gather data on their demographics, interests, and behaviors. This knowledge will allow you to tailor your content and messaging to resonate with them.
Create Quality Content: Content is king! Focus on delivering high-quality, valuable, and relevant content. This means well-researched articles, stunning visuals, and engaging videos that captivate your audience’s attention.
Use Eye-Catching Visuals: Humans are visual creatures. Incorporate compelling images, infographics, and videos into your posts. Visuals not only enhance the overall appeal but also encourage shares and comments.
Engage with Your Audience:Don’t just talk at your audience; invite them into the conversation. Respond to comments, ask questions, and create polls. The more you engage, the more invested your audience will feel.
Another effective strategy is to optimize your posting times. Analyze when your audience is most active and schedule your posts accordingly. This ensures that your content reaches your followers when they are most likely to engage.
Consistency is key. Establish a regular posting schedule and stick to it. This not only keeps your audience engaged but also builds trust and anticipation for your content. You might consider a content calendar to help you plan ahead.
Don’t shy away from collaboration! Partnering with influencers or brands that align with your values can expand your reach and introduce you to new audiences. A simple shout-out or collaborative post can do wonders for your engagement.
Lastly, leverage the power of analytics. Keep track of which types of posts generate the most engagement by using tools like Google Analytics or social media insights. Regularly assess your performance and adjust your strategy based on what works best.
By implementing these strategies, you’ll be well on your way to boosting your engagement rate and fostering a vibrant community around your content. Remember, the goal is to create meaningful connections, and engagement is the bridge that brings you closer to your audience.
Analyzing Trends Over Time for Deeper Insights
Understanding how engagement evolves over time is essential for businesses seeking to optimize their content strategies. By analyzing engagement trends, you can unlock deeper insights that inform future campaigns and refine your approach. Here are a few ways to harness the power of trend analysis:
Identify Patterns: Track engagement rates over specific time frames—weekly, monthly, or quarterly. Look for spikes and dips, and try to correlate these with specific campaigns, holidays, or content types.
Measure Consistency: Consistent engagement can indicate brand loyalty. Use long-term data to assess whether your audience is consistently interacting with your posts or if engagement fluctuates wildly.
Segment Your Audience: Analyze engagement data by different demographics or user segments. This can reveal which groups resonate more with your content and help tailor future messaging.
Test and Learn: Conduct A/B testing on various content types, posting times, and formats. Use the data to see what consistently drives higher engagement rates over time.
One effective way to visualize trends is through data tables. The following example presents a straightforward breakdown of engagement rate changes over a three-month period:
Month
Engagement Rate (%)
Comments
January
3.5
New Year Campaign launched.
February
2.8
Engagement dipped post-campaign.
March
4.2
Spring content boosted interactions.
As you analyze these fluctuations, draw conclusions about how different content strategies impacted audience behavior. For instance, if you notice a significant uptick in March, consider what specific elements contributed to that success. Was it the tone, the visuals, or perhaps a strategic partnership that drove traffic? Understanding these nuances can help replicate success in the future.
Moreover, consider incorporating external factors into your analysis. Seasonal trends, industry changes, and even economic factors can influence engagement rates. By keeping an eye on these elements, you can better anticipate changes in audience behavior and adjust your strategies accordingly.
Ultimately, the key to effective trend analysis lies in not just collecting data but interpreting it meaningfully. Use analytics tools to create visual reports that make patterns easier to grasp. This visual representation can help stakeholders understand the importance of engagement metrics and rally support for new initiatives.
By continually refining your approach based on trend analysis, you’ll not only improve your engagement rates but also cultivate a more informed, responsive marketing strategy. Embrace the insights that come from understanding how engagement fluctuates over time, and use that knowledge to foster a more engaged audience.
Leveraging Engagement Rate for Audience Understanding
Engagement rate is more than just a number; it represents a connection between your content and your audience. By understanding this metric, you can unlock valuable insights that go beyond surface-level statistics. Here’s how you can leverage engagement rate for a deeper understanding of your audience:
Identify Content Preferences: High engagement rates on specific posts indicate what resonates with your audience. Are they more into educational content, entertainment, or behind-the-scenes glimpses? Monitor these trends to tailor your future content strategy.
Audience Segmentation: Different audience segments may engage differently with your content. Use engagement rates to segment your audience based on interests or demographics, allowing you to create targeted campaigns.
Timing Insights: Evaluate when your posts receive the most engagement. This data can inform you about your audience’s online habits, helping you to publish content when they’re most active.
Content Format Effectiveness: Experiment with various formats—videos, infographics, or blogs—and measure their engagement rates. This experimentation will help you determine which formats yield the best responses from your audience.
To take your analysis a step further, consider implementing A/B testing on your posts. By comparing two variations of the same content, you can see which version has a higher engagement rate. This method provides actionable insights that guide your content creation moving forward.
Understanding engagement rate also allows you to track the performance of your campaigns over time. By establishing a baseline engagement rate, you can measure the impact of changes in your strategy, such as new messaging or different platforms. This continuous evaluation leads to smarter decisions.
If you’re collaborating with influencers or partners, their engagement rates can provide insight into their audience’s interests and behaviors. Analyzing these metrics helps ensure that your collaborative efforts align with the audience you are trying to reach.
Content Type
Engagement Rate
Audience Reaction
Blog Post
5%
Informative
Video
12%
Highly Engaging
Poll
20%
Interactive
Infographic
8%
Visual Appeal
Ultimately, leveraging engagement rate goes beyond just measuring success; it opens the door to meaningful conversations with your audience. By analyzing what sparks their interest and ignites their passion, you can foster a community that feels valued and heard. This understanding not only enhances your content strategy but also builds a loyal following that’s eager to engage.
Tools and Resources to Simplify Your Calculations
In the world of digital marketing, calculating your engagement rate can feel overwhelming. Fortunately, there are several tools and resources available to help simplify this process, making it easier for you to gain insights into your audience’s behavior.
One of the most popular tools for calculating engagement rates is Google Analytics. With Google Analytics, you can track metrics such as page views, unique visitors, and social media interactions. This comprehensive platform provides a detailed overview of how your content is performing, enabling you to adjust your strategies accordingly.
Another excellent resource is Social Media Analytics Tools. Platforms like Hootsuite, Buffer, and Sprout Social offer built-in analytics features that automatically calculate engagement rates across various social media channels. These tools allow you to easily compare engagement metrics, making it simple to identify which content resonates best with your audience.
For those who prefer a more hands-on approach, consider using Excel or Google Sheets. These platforms allow you to create custom formulas to calculate engagement rates based on your specific needs. You can set up a simple table like the one below to track your metrics:
Content Type
Likes
Shares
Comments
Engagement Rate (%)
Instagram Post
150
50
20
45%
Facebook Post
200
30
10
40%
Additionally, there are numerous online calculators specifically designed for engagement metrics. Websites like RiteTag and SocialBee provide quick and easy engagement rate calculators where you just input your data and get the results within seconds. This can save you time and ensure accuracy in your calculations.
Don’t forget about educational resources! Websites such as HubSpot and Buffer offer numerous articles, webinars, and tutorials on how to effectively measure engagement rates. By leveraging these resources, you can deepen your understanding of metrics and improve your overall marketing strategy.
Lastly, consider joining online communities or forums where marketers share their experiences and tools. Platforms like Reddit or Facebook groups dedicated to digital marketing can be gold mines for discovering new tools and techniques that might work for you.
Final Thoughts on Making Engagement Rate Work for You
Leveraging engagement rate effectively can transform your social media strategy from just another task into a powerful tool that drives results. Understanding its nuances helps you tailor your content, ensuring you speak directly to your audience’s interests and needs. Here are some key takeaways to consider:
Optimize Content for Your Audience: Knowing what resonates with your audience allows you to create more compelling content. Refer to your engagement metrics regularly to identify trends and adapt your strategy.
Experiment with Different Formats: Don’t shy away from testing various content types—videos, infographics, or polls. This experimentation can uncover what format drives the highest engagement for your specific audience.
Consistency is Key: Regular posting keeps your brand relevant and helps maintain a connection with your audience. However, ensure that quality isn’t sacrificed for quantity.
Engage Back: Remember that engagement is a two-way street. Responding to comments and messages not only strengthens your relationship with your audience but also increases overall engagement metrics.
As you dive deeper into the metrics, consider creating a table to track your engagement over time. This will help you visualize growth and pinpoint successful strategies:
Month
Posts
Engagement Rate (%)
Notes
January
10
5.2
Initial content launch
February
12
6.8
Increased video posts
March
15
7.5
Interactive polls
Utilizing this kind of tracking can make a significant difference. It not only provides clear insights but also motivates your team by showcasing progress. Additionally, regularly reviewing your engagement strategies will enable you to pivot quickly when something isn’t working, ensuring that your efforts are always aligned with audience expectations.
remember that engagement rate isn’t an end-all-be-all metric, but rather a valuable piece of the puzzle. Combining it with other performance indicators will give you a more comprehensive view of your marketing effectiveness. Embrace the numbers, but don’t forget the human element—stories, emotions, and connections are what ultimately drive engagement.
Frequently Asked Questions (FAQ)
Q&A: How to Calculate Engagement Rate: A Step-by-Step Guide to Smarter Metrics
Q: What is engagement rate, and why is it important? A: Great question! The engagement rate is a key metric that measures how actively your audience is interacting with your content. It’s crucial because it helps you understand the effectiveness of your posts, campaigns, and overall strategy. Higher engagement indicates a more connected audience, which can lead to better brand loyalty and conversions. Simply put, knowing your engagement rate allows you to gauge if you’re hitting the mark or missing the target!
Q: How do I calculate engagement rate? A: Calculating engagement rate is simpler than you might think! The basic formula is: [ text{Engagement Rate} = frac{text{Total Engagements}}{text{Total Followers}} times 100 ] Total engagements include likes, comments, shares, and any other interactions your post receives. Just plug those numbers into the formula, and voila! You’ll have your engagement rate percentage. It’s a straightforward way to quantify your audience’s interest!
Q: Are there different types of engagement rates? A: Absolutely! Depending on your platform and goals, you might want to look at different variations. For instance, you could calculate engagement rate per post, per follower, or even per impression. Each method offers unique insights. For example, if you want to assess the impact of a single post, you might use the per post formula. It’s all about what you’re trying to measure!
Q: How often should I calculate my engagement rate? A: Consistency is key! Ideally, you should calculate your engagement rate regularly—think monthly or quarterly. This frequency helps you spot trends over time and adjust your strategy accordingly. If a particular post performed well, you can analyze why and replicate that success in future content.
Q: What should I do if my engagement rate is low? A: Don’t panic! Low engagement rates can be an opportunity in disguise. Start by analyzing your content. Are your posts resonating with your audience? Consider experimenting with different formats, topics, and posting times. Don’t hesitate to engage with your audience more actively, ask for feedback, or even run polls. Sometimes, a little tweak can make a big difference!
Q: Can I use engagement rate to compare different platforms? A: Yes, but with a caveat! While you can calculate engagement rates across platforms, remember that each platform has its own unique audience behaviors and expectations. What works on Instagram may not resonate on LinkedIn, for example. Use engagement rates as a guideline rather than a strict comparison. Focus on how each platform performs for your specific goals.
Q: What’s the biggest takeaway from understanding engagement rates? A: The biggest takeaway is that engagement rates are not just numbers; they’re insights into how well you’re connecting with your audience. By understanding and tracking this metric, you can refine your content strategy, drive better engagement, and ultimately foster a stronger relationship with your audience. So, embrace the numbers—they can lead you to smarter marketing decisions!
If you have more questions about engagement rates or want to dive deeper into metrics, feel free to ask. Understanding these concepts can truly elevate your marketing game!
Insights and Conclusions
As we wrap up this deep dive into calculating engagement rate, it’s clear that understanding this metric is essential for anyone looking to elevate their social media game. Remember, engagement rate isn’t just a number—it’s a reflection of how well your audience connects with your content. By following the steps we’ve outlined, you can start transforming your metrics into actionable insights that drive real results.
So, why not take a moment to implement what you’ve learned today? Analyze your recent posts, calculate those engagement rates, and see what resonates with your audience. The beauty of these metrics is that they empower you to make informed decisions, refine your strategy, and ultimately build a more engaged community around your brand.
Don’t forget, the world of social media is ever-evolving. Keeping a close eye on your engagement rate will not only help you stay ahead of the curve but will also allow you to adapt and thrive in this dynamic landscape.
Now, go ahead! Dive into your analytics, experiment with your content, and watch as your engagement flourishes. You’ve got the tools—it’s time to put them to work and make your mark! Happy measuring!