Introduction:
In today’s digital landscape, having a website is just the beginning. Whether you’re a small business owner, a blogger, or part of a large corporation, your website is often the first point of contact for potential customers. But how do you know if it’s performing well? That’s where the concept of Key Performance Indicators, or KPIs, comes into play. Think of KPIs as the vital signs of your website—they help you measure how well your online presence is doing and highlight areas that need improvement. In this article, we’ll dive into what exactly a website KPI is, why tracking them is crucial for your success, and which specific metrics you should keep an eye on. Ready to unlock the secrets to a high-performing website? Let’s get started!
Understanding the Concept of Website KPIs
When it comes to measuring the success of your website, understanding the right metrics is essential. Key Performance Indicators (KPIs) serve as the guiding stars for your online strategy, illuminating the path to achieving your business goals. These indicators provide insights into how well your website is performing and where improvements can be made. By focusing on the right KPIs, you can make informed decisions that enhance user experience and boost conversions.
So, what exactly qualifies as a website KPI? In essence, a KPI is a measurable value that demonstrates how effectively a company is achieving its key business objectives. For websites, these metrics can range from traffic and engagement levels to conversion rates and customer retention. Tracking these indicators not only helps you understand your audience but also allows you to pinpoint areas that need attention.
Here are some crucial KPIs to consider for your website:
- Traffic Sources: Understand where your visitors are coming from, whether it’s organic search, social media, or paid advertising.
- Bounce Rate: A high bounce rate can indicate that users aren’t finding what they expect, suggesting a need for content improvement.
- Average Session Duration: This metric indicates how long visitors stay on your site, providing insight into content engagement.
- Conversion Rate: One of the most critical KPIs, it measures the percentage of visitors who complete a desired action.
Different websites may prioritize different KPIs based on their unique goals. For instance, an e-commerce site might focus heavily on conversion rates and average order value, while a blog may prioritize engagement metrics such as time on page and social shares. The key is to select KPIs that align with your objectives and give you a clear picture of your website’s performance.
To effectively track these KPIs, it’s crucial to utilize analytics tools. Google Analytics is a popular choice, offering a wealth of data that can be customized according to your specific needs. By setting up dashboards and reports, you can easily monitor these KPIs and make data-driven decisions.
Here’s a simple comparison table of common website KPIs to help clarify their significance:
| KPI | Definition | Importance |
|---|---|---|
| Traffic Sources | Where your visitors originate from. | Helps understand effective marketing channels. |
| Bounce Rate | The percentage of visitors who leave after viewing one page. | Indicates user dissatisfaction or irrelevant content. |
| Conversion Rate | The percentage of visitors completing a desired action. | Measures overall website effectiveness in achieving goals. |
Ultimately, understanding and tracking the right website KPIs can dramatically influence your online success. By regularly analyzing these metrics, you can identify trends, optimize user experiences, and drive stronger results for your business. Don’t just collect data; leverage it to create a website that resonates with your audience and fulfills your objectives.
Why Tracking KPIs is Essential for Your Online Success
Tracking key performance indicators (KPIs) is crucial for understanding the effectiveness of your online presence. By monitoring these metrics, you can gain valuable insights into how well your website is performing and identify areas for improvement. Here are several reasons why keeping an eye on KPIs is not just beneficial, but essential for your online success:
- Informed Decision-Making: By tracking KPIs, you have concrete data to guide your business decisions. Instead of relying on gut feelings, you can use actual numbers to understand what’s working and what’s not.
- Goal Setting: KPIs provide a benchmark against which you can measure your progress. Setting specific, measurable goals helps to focus your efforts and aligns your team toward a common objective.
- Performance Improvement: Monitoring KPIs helps you spot trends and patterns in your data. This visibility allows you to make timely adjustments to your strategies, optimizing your performance over time.
- Resource Allocation: Understanding which areas of your website are underperforming can help you allocate resources more effectively. You can invest more time and money into the strategies that yield the best results.
- Customer Insights: KPIs often reveal valuable insights about your audience. Knowing how visitors interact with your site can help tailor your approach to better meet their needs.
To effectively track KPIs, it’s essential to focus on the right metrics. Here’s a quick look at some of the most impactful KPIs you should consider:
| KPI | Description |
|---|---|
| Traffic Sources | Identifies where your visitors are coming from (e.g., organic search, social media, direct visits). |
| Bounce Rate | Measures the percentage of visitors who leave your site after viewing only one page. |
| Conversion Rate | The percentage of visitors who complete a desired action (e.g., signing up for a newsletter). |
| Average Session Duration | Indicates how long visitors stay on your site, reflecting their engagement level. |
| Page Load Time | Measures how quickly your pages load, impacting user experience and SEO rankings. |
By diligently tracking these KPIs, you can not only measure your website’s performance but also enhance it. This process creates a feedback loop where you can continuously adapt and refine your strategies based on real-time data. In the fast-paced online world, agility and awareness are your best allies.
Ultimately, the act of tracking KPIs transforms your approach from reactive to proactive. Instead of waiting to face challenges, you can anticipate them and pivot your strategies accordingly. This forward-thinking mindset is what separates thriving online businesses from those that merely survive.

The Key Difference Between KPIs, Metrics, and Goals
Understanding the distinction between KPIs, metrics, and goals is crucial for enhancing your website’s performance. While these terms are often used interchangeably, they serve different purposes in the realm of data analysis and strategic planning.
Key Performance Indicators (KPIs) are specific, measurable values that demonstrate how effectively a company is achieving its key business objectives. They are typically high-level metrics that reflect the success of an organization in reaching its targets. For instance, if your goal is to increase website conversions, a KPI might be the conversion rate—the percentage of visitors who take a desired action.
Metrics, on the other hand, are broader measurements used to gauge the performance of various aspects of your website. While all KPIs are metrics, not all metrics qualify as KPIs. Metrics provide essential data points that help you understand the performance of your website in various areas, such as:
- Traffic sources
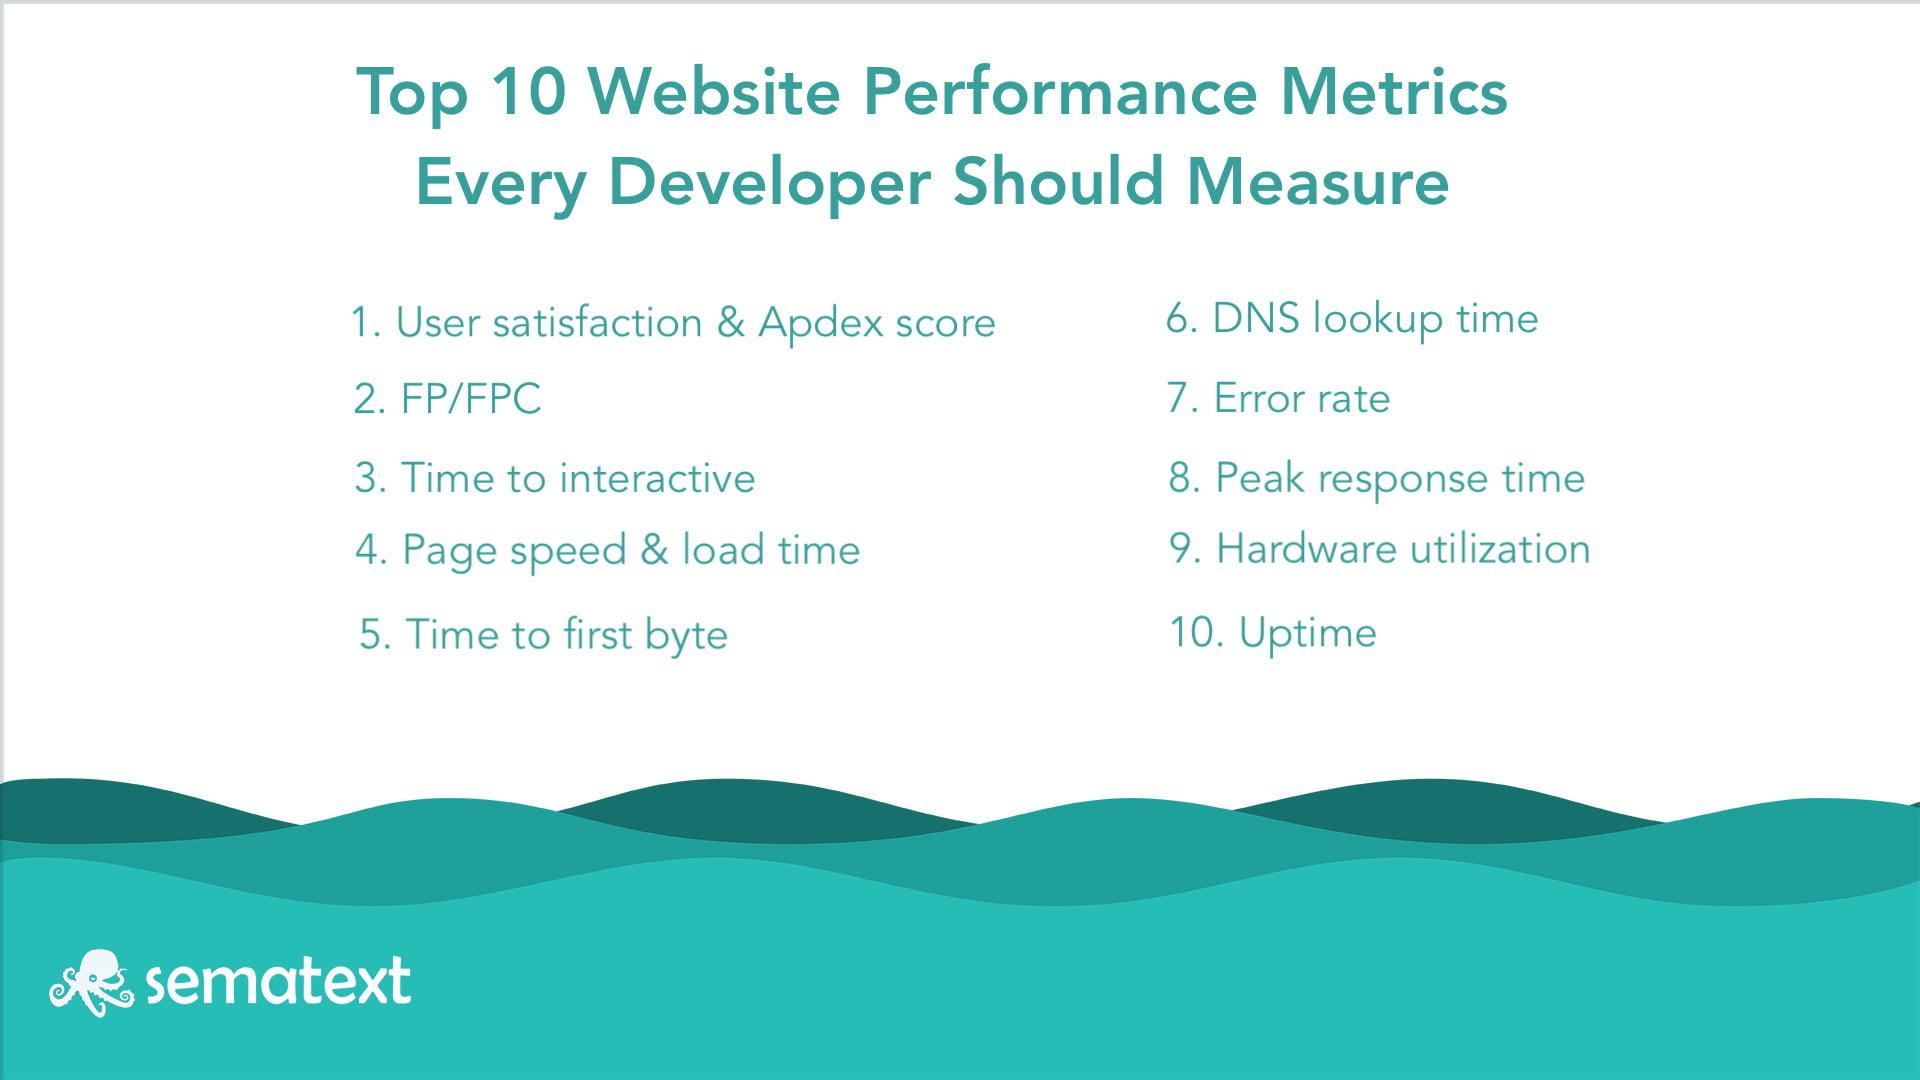
- Page load time
- Bounce rate
- Average session duration
Goals represent the overarching aspirations or objectives that guide your website strategy. They are the long-term visions that inform both the KPIs and the metrics you choose to track. For example, a goal might be to increase overall website traffic by 50% over the next year. This goal informs your choice of KPIs, such as monthly unique visitors, and the metrics you monitor, like the number of pages viewed per session.
To clarify this relationship, consider the following table that outlines the differences between these concepts:
| Aspect | KPIs | Metrics | Goals |
|---|---|---|---|
| Definition | Critical measures of performance | Quantitative data points | Long-term objectives |
| Focus | Strategic outcomes | Operational details | Future aspirations |
| Examples | Conversion rate, customer satisfaction | Traffic, page views, bounce rate | Increase traffic by 50% |
When you align your KPIs with your specific goals, you create a powerful framework for measuring success. Tracking KPIs without a clear goal in mind can lead to a disjointed approach, while monitoring metrics in isolation may dilute the strategic focus. Effective integration of all three elements ensures you not only collect valuable data but also interpret it in a way that drives meaningful results.
recognizing the differences between KPIs, metrics, and goals allows you to create a focused, data-driven strategy for your website. By selecting the right KPIs to track, you can measure progress against your goals and make informed decisions that propel your business forward.
How to Identify the Right KPIs for Your Website
When it comes to evaluating your website’s performance, identifying the right Key Performance Indicators (KPIs) is crucial. KPIs act as measurable values that help you gauge how effectively your website meets its objectives. But with so many metrics to choose from, how do you determine which ones are important for your specific goals?
First, consider your overall business objectives. Are you focused on increasing sales, generating leads, or enhancing brand awareness? The KPIs you track should align closely with these goals. For example:
- Sales Growth: Track conversion rates and revenue per visitor.
- Lead Generation: Focus on the number of leads captured through forms or newsletter sign-ups.
- Brand Awareness: Monitor traffic sources and social media engagement levels.
Next, think about the user journey on your website. Which actions do you want users to take? Identifying the key steps in the user experience can help you pinpoint essential metrics. Some pivotal KPIs include:
- Bounce Rate: A high bounce rate may indicate that visitors aren’t finding what they expect.
- Average Session Duration: Longer sessions often correlate with higher engagement.
- Pages per Session: This KPI helps you understand how effectively your content keeps visitors interested.
Another factor to consider is the demographic information of your audience. Understanding who visits your website can impact your marketing strategies significantly. Relevant metrics might include:
- User Location: Knowing where your visitors come from can guide localized marketing efforts.
- Device Type: Track if your audience prefers mobile or desktop browsing to tailor your design accordingly.
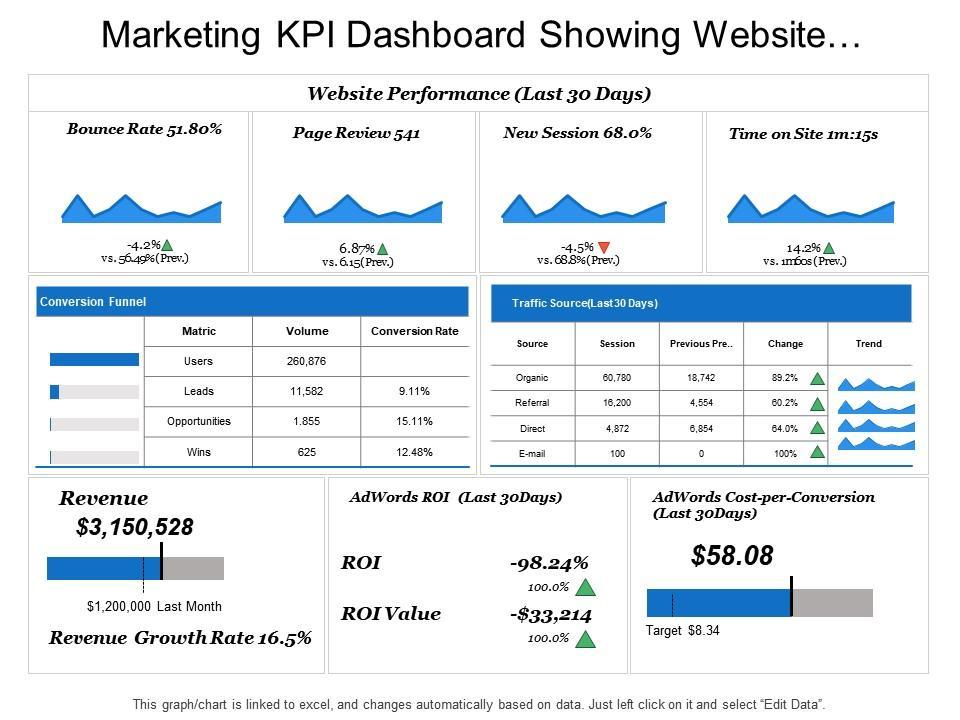
A well-organized dashboard can simplify KPI tracking. Utilize tools like Google Analytics and create visual representations of your data. A table can help summarize essential KPIs:
| Metric | Purpose | Ideal Range |
|---|---|---|
| Bounce Rate | Indicates visitor satisfaction | 40% – 60% |
| Conversion Rate | Measures effectiveness of calls-to-action | 2% – 5% |
| Average Session Duration | Reflects content engagement | 2+ minutes |
Lastly, don’t forget to regularly review and adapt your KPIs. As your business evolves, so do your objectives and the metrics that align with them. Periodic assessments ensure that you stay on the right track and can pivot when necessary.
Traffic Sources: Where Your Visitors Are Coming From
Understanding where your visitors originate is essential for tailoring your marketing strategies effectively. By analyzing your traffic sources, you gain insights into which channels are performing best and where to allocate your resources for maximum impact.
Here are some common traffic sources that you should consider tracking:
- Organic Search: Visitors arriving from search engines, indicating the effectiveness of your SEO efforts.
- Direct Traffic: Users who type your URL directly into their browser, often reflecting brand strength or previous exposure.
- Referral Traffic: Visitors coming from links on other websites, showcasing the value of partnerships and backlinks.
- Social Media: Traffic generated via platforms like Facebook, Twitter, and Instagram, highlighting the impact of your social media presence.
- Email Marketing: Users clicking links in your newsletters or promotional emails, emphasizing the importance of email campaigns.
Each traffic source tells a story about your audience’s behavior and preferences. For instance, if you notice a significant amount of traffic from social media, it suggests that your content resonates well with users on those platforms. Conversely, a lack of referral traffic might indicate missed opportunities for collaborations or guest posting.
To effectively visualize your traffic sources, consider using a simple table that summarizes the percentage of visitors from each source. This can help you quickly identify trends or areas needing attention.
| Traffic Source | Percentage of Total Visitors |
|---|---|
| Organic Search | 45% |
| Direct Traffic | 30% |
| Referral Traffic | 15% |
| Social Media | 7% |
| Email Marketing | 3% |
By closely monitoring these metrics, you can adapt your strategies to focus on the channels that drive the most traffic. For instance, if you see that organic search is the leading source, investing further in SEO could be a wise choice. Alternatively, if social media is underperforming, it might be time to refine your content or engagement tactics.
Ultimately, the goal is to create a holistic view of your website’s performance. Understanding where your visitors are coming from allows you to make informed decisions that enhance user experience, optimize content delivery, and boost conversions. Don’t just track these metrics—use them as a roadmap for growth!
Engagement Metrics That Matter for Your Content
When it comes to understanding how your audience interacts with your content, engagement metrics are the key indicators that reveal the effectiveness of your strategy. These metrics not only help you gauge audience interest but also inform your future content creation efforts. Here are some essential engagement metrics that you should keep an eye on:
- Click-Through Rate (CTR): This metric measures how many users clicked on your content compared to how many saw it. A higher CTR indicates that your title and description are compelling enough to entice clicks.
- Average Time on Page: This tells you how long visitors are staying on your content. If the time is low, it may indicate that your content isn’t engaging or valuable enough to hold their attention.
- Bounce Rate: This represents the percentage of visitors who leave your site after viewing only one page. A high bounce rate can be a red flag, suggesting that your content might not be meeting user expectations.
- Social Shares: Tracking how often your content is shared across social platforms can provide insights into its relevance and appeal. Content that resonates well is more likely to be shared, extending your reach.
- Comments and Interactions: Engagement in the form of comments or discussions can signal that your content is sparking interest and conversation among your audience.
Monitoring these metrics enables you to make data-driven decisions. For example, if you notice a low average time on page, it might be time to revisit your content structure. Perhaps adding engaging visuals, improving readability, or providing more valuable insights can enhance user experience.
Additionally, consider using A/B testing to fine-tune your headlines and calls to action. By experimenting with different approaches, you can discover which elements resonate most with your audience, ultimately leading to better engagement rates.
To visualize the effectiveness of your content, here’s a simple table that summarizes the relationship between these engagement metrics and content performance:
| Engagement Metric | Significance | Actionable Insight |
|---|---|---|
| Click-Through Rate | Indicates headline effectiveness | Revise titles for better allure |
| Average Time on Page | Measures content depth | Add more engaging elements |
| Bounce Rate | Shows content relevance | Enhance first impressions |
| Social Shares | Reflects content virality | Incorporate shareable formats |
| Comments | Indicates audience interaction | Encourage discussions |
focusing on these engagement metrics can significantly elevate your content strategy. By actively tracking and analyzing these KPIs, you can refine your approach, boost audience interaction, and ultimately drive more meaningful results for your website.

Conversion Rates: Turning Visitors into Customers
When it comes to boosting your online business’s success, understanding conversion rates is fundamental. These metrics reveal how effectively your website transforms casual visitors into loyal customers. A high conversion rate signifies that your marketing strategies are resonating with your audience, while a low rate may indicate room for improvement. Let’s explore what factors influence these rates and how you can enhance them.
One of the primary elements affecting conversion rates is the user experience. If visitors find your website difficult to navigate or slow to load, they’re likely to abandon their shopping journey. To ensure a smooth experience, consider these aspects:
- Responsive Design: Ensure your site is mobile-friendly to accommodate users on various devices.
- Fast Load Times: Optimize images and scripts to minimize loading times.
- Clear Navigation: Use intuitive menus and search functions to help users find what they need quickly.
Another crucial factor is the quality of your content. Engaging, relevant content can captivate visitors and encourage them to take action. This includes using compelling headlines, persuasive product descriptions, and high-quality images. Don’t forget the power of call-to-action (CTA) buttons; they should be clear and enticing. Here are some tips for creating effective CTAs:
- Use Action-Oriented Language: Words like “Get Started,” “Shop Now,” or “Join Today” can prompt users to act.
- Make CTAs Stand Out: Use contrasting colors and strategic placement to draw attention.
- Test Variations: Experiment with different wording, colors, and placements to see what resonates best with your audience.
It’s also essential to leverage social proof. Customer testimonials, reviews, and case studies can significantly influence potential buyers’ decisions. By showcasing positive experiences from existing customers, you build trust and credibility. Consider incorporating a section on your homepage or product pages dedicated to showcasing this social proof:
| Customer Name | Review |
|---|---|
| Jane Doe | “This product changed my life! Highly recommend.” |
| John Smith | “Exceptional service and quality. Will definitely return!” |
Lastly, don’t underestimate the importance of A/B testing. Regularly testing different elements on your website can provide insights into what works best for your audience. From headlines to button colors, small changes can lead to significant improvements in conversion rates. Make it a habit to analyze results and adjust your strategies accordingly.
By focusing on these key areas, you can create a website that not only attracts visitors but also converts them into paying customers. Remember, the journey from visitor to customer is not just about the final click but also about crafting a seamless experience that encourages repeated engagement. Your website’s conversion rate is a powerful indicator of your success, so invest the time and effort to optimize it effectively.

Bounce Rate: What It Tells You About User Experience
Bounce rate is a crucial metric that can unveil significant insights into user interactions on your website. Essentially, it represents the percentage of visitors who leave your site after viewing just one page. A high bounce rate may indicate that users are not finding what they are looking for or that the overall user experience is lacking. Understanding this KPI can help you pinpoint areas for improvement and enhance user engagement.
To interpret bounce rate effectively, it’s essential to consider the context. Not all pages on a website are created equal, and a high bounce rate on a blog post might not be alarming, since users may find the information they need in a single read. However, if your landing page or product pages show a high bounce rate, this could be a red flag, signaling issues such as:
- Poor Page Load Times: If your site takes too long to load, users are likely to leave before they even see your content.
- Non-Responsive Design: With more users accessing websites via mobile devices, a site that isn’t mobile-friendly can drive users away.
- Unclear Messaging: If visitors can’t quickly discern what your site offers, they may bounce instead of exploring further.
- Tiring Navigation: Complicated navigation can frustrate users and lead them to exit instead of searching for what they want.
To enhance user experience and reduce bounce rates, consider implementing the following strategies:
- Improve Load Speed: Optimize images, utilize browser caching, and minimize HTTP requests to ensure your site loads quickly.
- Optimize for Mobile: Ensure that your site is responsive and easy to navigate on any device.
- Clear Call-to-Action: Make sure your calls-to-action are visible and compelling, guiding users toward the next steps you want them to take.
- Engaging Content: Create high-quality, relevant content that meets the needs of your audience and encourages them to explore more pages.
It’s also beneficial to segment your bounce rate by traffic sources. This allows you to identify which channels are driving disengaged users to your site. Consider creating a simple table to visualize these differences:
| Traffic Source | Bounce Rate (%) |
|---|---|
| Organic Search | 45% |
| Social Media | 60% |
| Email Campaigns | 30% |
| Paid Ads | 50% |
Understanding the nuances of your bounce rate can transform your approach to website optimization. With careful analysis and strategic adjustments, you can create a more engaging user experience that not only reduces bounce rates but also increases conversions. Remember, every visitor counts, and improving their experience on your site can lead to lasting connections and increased loyalty.
Session Duration: Measuring Visitor Engagement
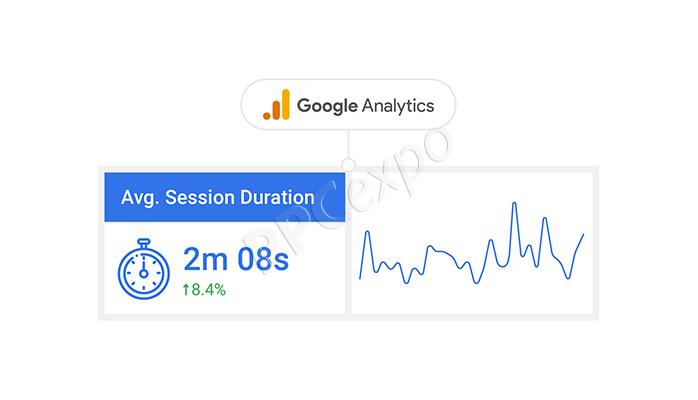
Understanding how long visitors stay on your website is crucial for evaluating their engagement. Session duration is a powerful metric that offers insights into the effectiveness of your content and user experience. When users linger on your site, it often indicates that they find your material valuable and worth exploring. Conversely, a short session duration may signal that your content isn’t resonating or that users are struggling to navigate your site.
To put it simply, measuring session duration provides a tangible way to assess how well your website captivates and retains visitors. Here are some key reasons why you should prioritize this metric:
- Content Quality: Longer sessions typically imply that visitors are interacting with multiple pages, indicating high-quality content that meets their needs.
- User Experience: A well-structured, easy-to-navigate website encourages users to explore further, leading to increased session durations.
- Conversion Potential: The longer a visitor spends on your site, the more likely they are to convert, whether that means making a purchase, signing up for a newsletter, or completing a contact form.
To accurately measure session duration, you’ll want to analyze data from tools like Google Analytics. Here’s a quick overview of some key points to consider:
| Metric | Description |
|---|---|
| Average Session Duration | The mean time users spend on your site during a single visit. |
| Session Duration Trend | How session duration changes over time can indicate shifts in user engagement. |
| Pages per Session | A higher number suggests users are exploring more content, enhancing overall session duration. |
Keep in mind that session duration can vary significantly across different traffic sources. For example, organic traffic may yield longer sessions compared to social media referrals. Therefore, segmenting your data can provide deeper insights into which channels drive the most engaged visitors.
It’s also essential to establish benchmarks for your industry. Knowing what constitutes a good average session duration can help you gauge your performance more effectively. For instance, here’s a general guideline:
| Industry | Average Session Duration |
|---|---|
| Blogging | 2-4 minutes |
| E-commerce | 3-5 minutes |
| Corporate | 1-3 minutes |
To improve session duration, consider implementing strategies like optimizing content for readability, enhancing site speed, and ensuring mobile-friendliness. Engaging multimedia elements, such as videos or infographics, can also keep users on your page longer. Ultimately, the key is to create a seamless, enjoyable experience that invites visitors to stick around and explore.
Customer Acquisition Cost: Evaluating Your Marketing Efficiency
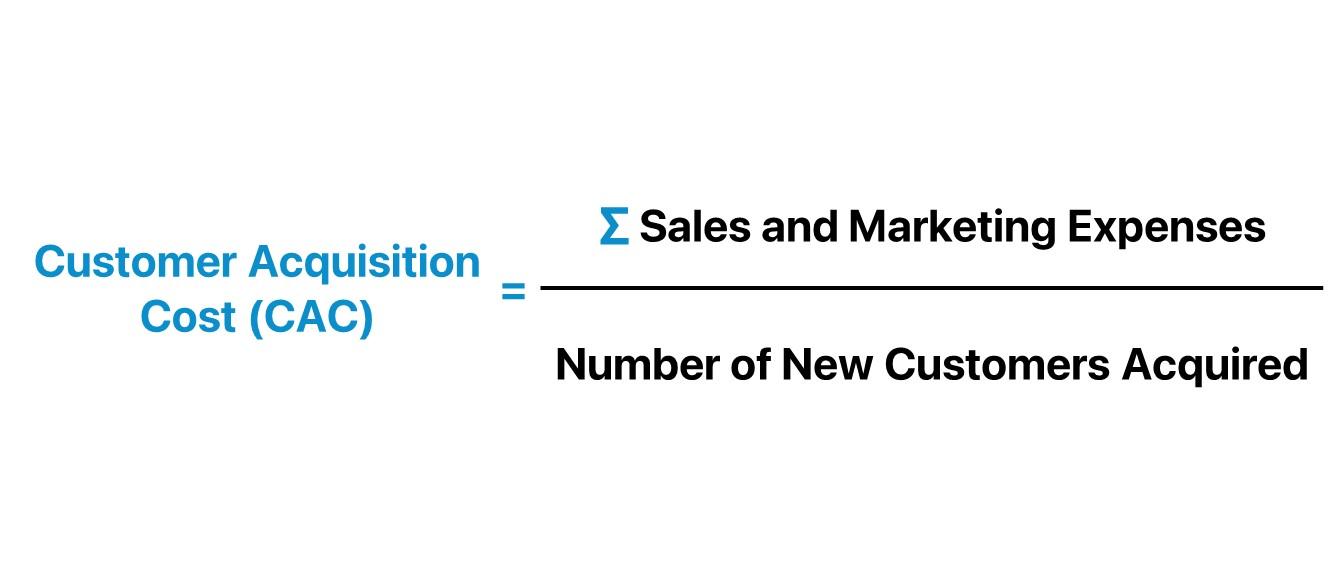
Understanding your Customer Acquisition Cost (CAC) is crucial for measuring the efficiency of your marketing efforts. CAC is the total cost of acquiring a new customer, encompassing all expenses related to marketing and sales divided by the number of customers gained during a specific period. By evaluating this metric, you can gain insights into the effectiveness of your marketing strategies and identify areas for improvement.
To calculate your CAC effectively, consider including the following expenses:
- Advertising costs
- Marketing staff salaries
- Software and tools for marketing
- Sales team expenses
- Public relations costs
Once you have your total expenses, the formula to find your CAC is straightforward:
| Total Marketing Expenses | Number of New Customers Acquired | Customer Acquisition Cost |
|---|---|---|
| $5,000 | 100 | $50 |
A CAC of $50 indicates that you are spending $50 to acquire each new customer. Understanding this figure helps you analyze whether your marketing strategies are sustainable in the long term. Ideally, you want your CAC to be significantly lower than the lifetime value (LTV) of your customers, ensuring profitability.
To improve your marketing efficiency, focus on strategies that can lower your CAC:
- Enhance your targeting: Use data analytics to reach your ideal customers more effectively.
- Optimize your sales funnel: Identify and eliminate bottlenecks that may be causing potential customers to drop off.
- Invest in content marketing: High-quality content can drive organic traffic and reduce reliance on paid ads.
- Leverage social proof: Encourage satisfied customers to share their experiences through reviews and testimonials.
Monitoring your CAC over time allows you to make data-driven decisions. If you notice a rising trend in your CAC, it might be time to reassess your marketing strategies. Are your campaigns resonating with your target audience? Are you optimizing your ad spend effectively? Regularly tracking this KPI can provide clarity and direction for your marketing efforts.
understanding and evaluating your Customer Acquisition Cost is essential for assessing the overall effectiveness of your marketing campaigns. By keeping a close eye on this metric and implementing strategies to optimize it, you can ensure that your marketing dollars are being spent wisely, leading to sustainable business growth.

The Importance of Return on Investment for Digital Efforts
When it comes to digital marketing efforts, gauging the effectiveness of your initiatives is crucial for long-term success. One key metric that often gets overlooked is Return on Investment (ROI). Understanding ROI can not only guide your current strategies but also shape your future decisions. When you invest time, money, or resources into your website, measuring ROI allows you to see the real impact of those investments.
To grasp the importance of ROI, consider how it helps you:
- Evaluate Performance: It provides a clear picture of what’s working and what isn’t, allowing you to optimize your approach.
- Make Informed Decisions: Armed with accurate data, you can allocate your budget more effectively, focusing on high-performing strategies.
- Set Realistic Goals: Understanding past performance helps in setting achievable targets for future campaigns.
Moreover, the digital landscape is ever-changing. What worked last year may not yield the same results today. Regularly assessing your ROI helps you stay agile, adapting to new trends or shifts in customer behavior. For instance, a campaign that was once central to your strategy may become less effective over time. By keeping a close eye on your ROI, you can pivot quickly, ensuring your efforts remain relevant and impactful.
It’s also important to track various KPIs (Key Performance Indicators) that contribute to your ROI. These metrics can include:
- Conversion Rate: The percentage of visitors who take a desired action, such as making a purchase or signing up for a newsletter.
- Customer Acquisition Cost (CAC): The total cost of acquiring a new customer, helping you understand the efficiency of your marketing spend.
- Lifetime Value (LTV): An estimate of the total revenue a customer will generate during their relationship with your business.
By measuring these KPIs, you can create a comprehensive view of your digital performance. A solid ROI calculation helps translate these KPIs into actionable insights. For example, if your CAC is rising but your LTV remains steady, you may need to refine your marketing approach to enhance profitability.
| Metric | Description | Importance |
|---|---|---|
| Conversion Rate | Percentage of visitors who complete a desired action | Indicates effectiveness of your website in generating leads or sales |
| Customer Acquisition Cost | Total cost spent to acquire a new customer | Helps assess marketing efficiency and budget allocation |
| Lifetime Value | Total revenue expected from a customer over their lifetime | Guides investment decisions and customer relationship strategies |
Ultimately, ROI is more than just a number; it’s a key indicator of your digital marketing health. By prioritizing ROI in your strategy, you’re not only measuring success but also paving the way for sustainable growth. With a thorough understanding of your ROI and associated KPIs, you can confidently navigate the complexities of the digital landscape, ensuring that every effort you make contributes to your bottom line.
Setting Up a KPI Dashboard for Easy Monitoring
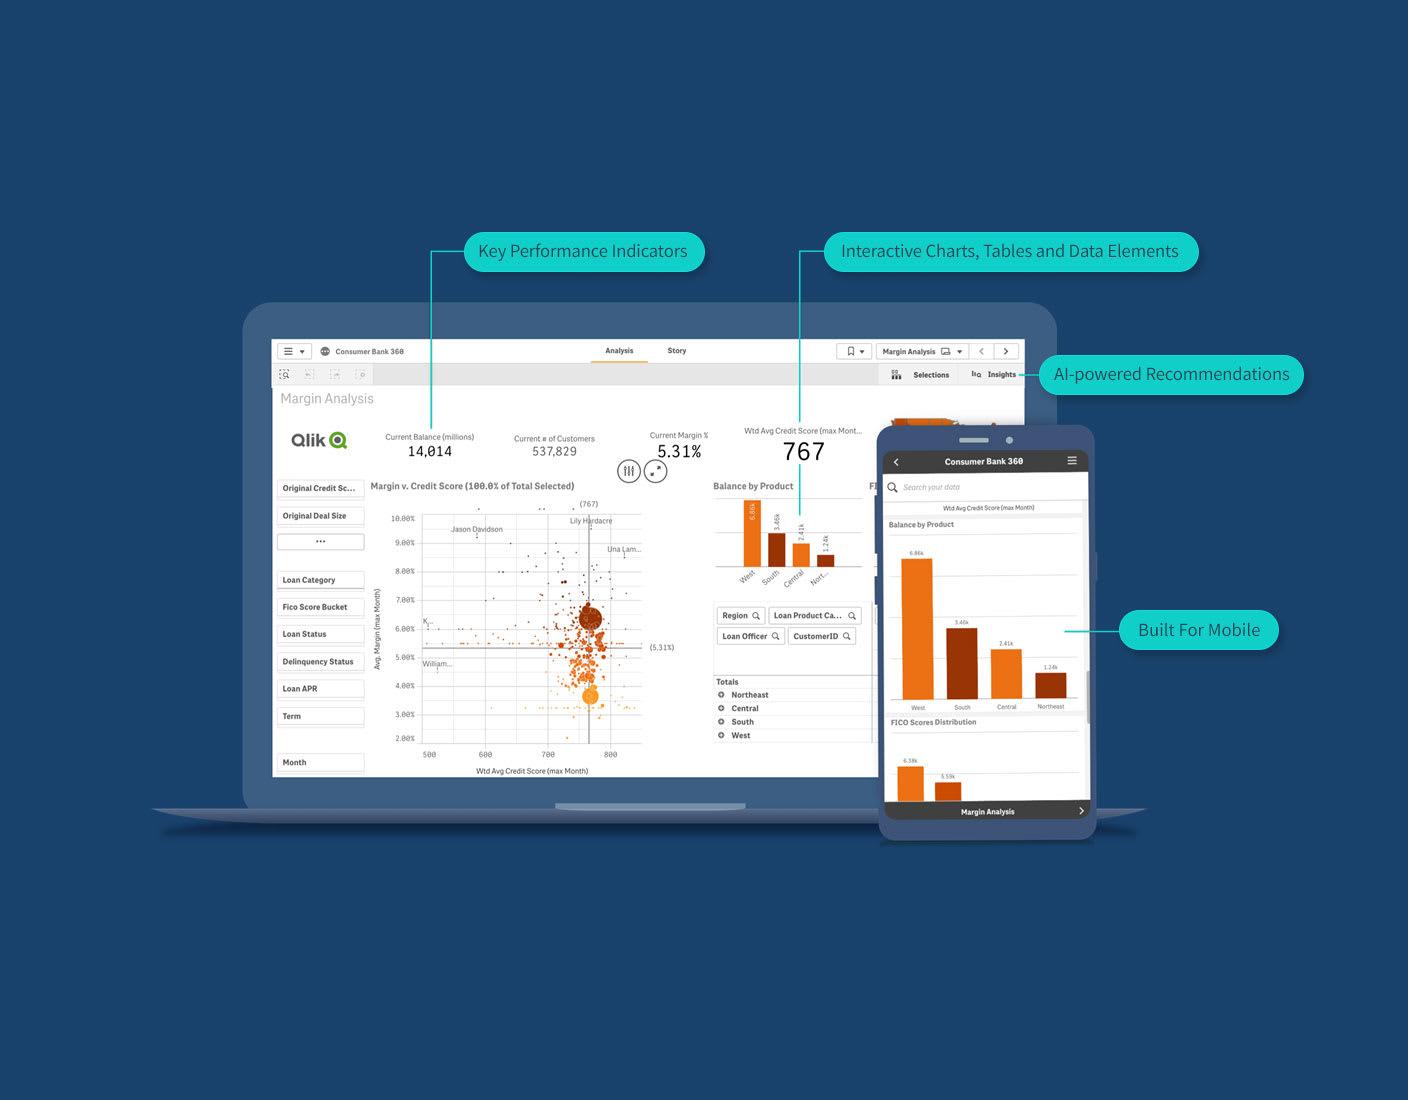
Creating a KPI dashboard is crucial for tracking the performance of your website effectively. It serves as a visual representation of your key metrics, allowing you to monitor progress and make data-driven decisions. Here are some essential steps to set up an effective KPI dashboard:
- Identify Your Key Objectives: Start by clarifying what you want to achieve. This could be increasing traffic, improving conversion rates, or enhancing user engagement.
- Select Relevant KPIs: Choose indicators that align with your objectives. For example, if your goal is to boost sales, focus on metrics like conversion rate, average order value, and bounce rate.
- Choose the Right Tools: There are several tools available for creating dashboards, from Google Data Studio to Tableau. Select one that suits your needs and expertise.
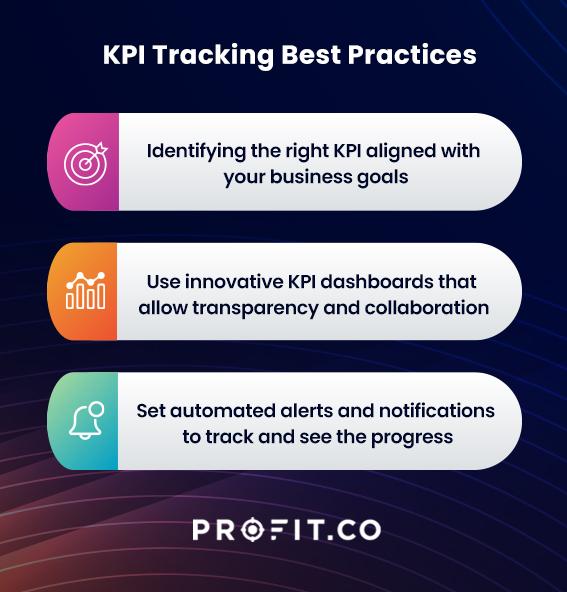
- Design for Clarity: Your dashboard should be easy to read and interpret. Use colors, graphs, and charts to enhance understanding. Keep it uncluttered to avoid overwhelming viewers.
Once you’ve set up your dashboard, it’s essential to regularly update it with accurate data. This ensures that the insights you gain are timely and relevant. Automate data collection where possible to minimize manual input errors and save time. Integrating tools like Google Analytics can help streamline this process.
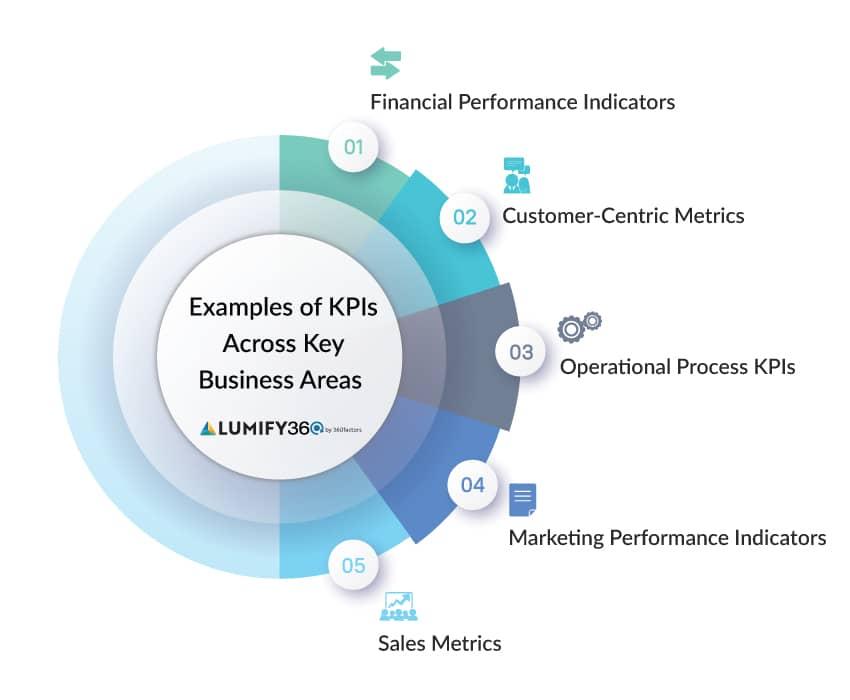
Consider categorizing your KPIs for a more structured view. This allows you to break down performance by different aspects of your website. For example, you can have sections for:
| Category | Key Performance Indicators |
|---|---|
| Traffic Metrics | Sessions, Page Views, Unique Visitors |
| User Engagement | Bounce Rate, Average Session Duration, Pages per Session |
| Conversion Metrics | Conversion Rate, Lead Generation, Sales Revenue |
Regularly reviewing your dashboard is equally important. Set aside time weekly or monthly to analyze trends and adjust your strategies accordingly. Look for patterns over time; for example, if you notice a spike in traffic coinciding with specific campaigns, you can replicate that success in the future.
Lastly, share your findings with your team. A KPI dashboard is not just a personal tool; it should foster a culture of accountability and transparency. By involving your team in the monitoring process, everyone can contribute ideas and improvements based on real data. This collaborative approach can lead to better results and a more engaged workforce.
Regularly Reviewing Your KPIs for Continuous Improvement
Monitoring your key performance indicators (KPIs) is not just a one-time task; it’s an ongoing process that requires regular attention and adjustment. By routinely reviewing your KPIs, you can identify trends, uncover issues, and implement improvements that drive your website’s success. This proactive approach transforms KPIs from mere metrics into actionable insights.
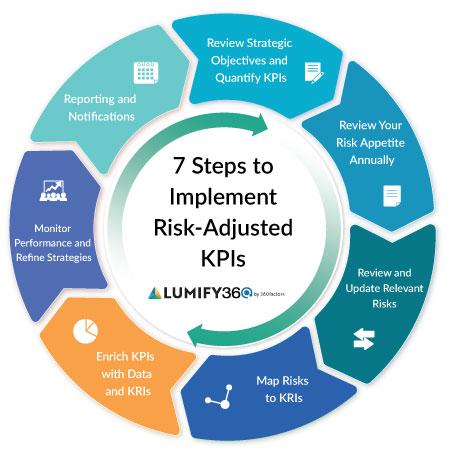
To make the most of your KPI reviews, consider setting a schedule that works for you—whether it’s monthly, quarterly, or bi-annually. This consistency helps in recognizing patterns over time. Here’s how you can make your review process effective:
- Set Clear Objectives: Before diving into your data, clarify what you want to achieve. Are you looking to increase traffic, enhance user engagement, or boost conversions? Knowing your goals will help you focus on the right KPIs.
- Analyze Trends: Look for trends in your data. For instance, if your bounce rate is climbing, it might be time to investigate your content or layout. Use visualization tools to make these trends easier to spot.
- Benchmark Against Competitors: Comparing your KPIs to industry standards can provide context and highlight areas needing improvement. Knowing where you stand can motivate your team to strive for excellence.
- Involve Your Team: Engaging your team in KPI discussions fosters a culture of accountability and innovation. Different perspectives can lead to new ideas for improvement.
Another effective strategy is to employ a feedback loop. Once you identify a KPI that needs attention, implement changes and monitor their impact. This iterative process allows you to refine your strategies continuously. Consider using a simple table to summarize your findings and the actions you plan to take:
| KPI | Current Status | Action Plan |
|---|---|---|
| Bounce Rate | 65% | Improve landing page design and content relevance. |
| Conversion Rate | 2% | Test new call-to-action buttons and optimize checkout process. |
| Average Session Duration | 1:30 mins | Create more engaging content and enhance navigation. |
Lastly, don’t forget to celebrate your successes. Acknowledging improvements and milestones can boost team morale and encourage a continuous improvement mindset. Sharing these achievements can also help align your team towards common goals, reinforcing the importance of KPIs in your overall strategy.
consistently reviewing your KPIs is not just about keeping tabs; it’s about fostering a culture of growth and adaptability within your organization. By making this a regular practice, you set your website on a path of continuous improvement, ensuring it remains competitive and effective in achieving your business objectives.
Taking Action: How to Use Your KPI Data to Drive Results
Once you’ve identified your key performance indicators (KPIs), the next step is to leverage this data to foster growth and achieve your business objectives. Here’s how to transform numbers and metrics into actionable insights that will drive your website’s success.
Set Clear Goals
Before diving into data analysis, it’s essential to outline specific, measurable, achievable, relevant, and time-bound (SMART) goals. This clarity will help ensure your KPIs are not just numbers on a dashboard but are aligned with your broader business strategy. For instance:
- Increase organic traffic by 25% within six months.
- Reduce bounce rate to below 40% over the next quarter.
- Improve conversion rates from 2% to 4% by year-end.
Monitor Trends and Patterns
Data is most powerful when you analyze trends rather than isolated data points. Regularly review your KPIs to identify patterns over time. For example, if you notice that traffic spikes during specific months, investigate further. Perhaps seasonal promotions or content marketing strategies are working well. Understanding these dynamics helps you optimize your strategy accordingly.
Segment Your Data
Not all visitors are equal. Segmenting your data can unveil insights that are masked in aggregate numbers. Consider breaking down your KPIs by:
- Demographics (age, gender, location)
- Traffic source (organic, referral, social media)
- User behavior (new vs. returning visitors)
This segmentation enables targeted strategies tailored to specific audience types, enhancing engagement and conversion potential.
Implement A/B Testing
To make informed decisions based on your KPI data, utilize A/B testing to experiment with different approaches. Whether it’s tweaking a call-to-action button or changing the layout of a landing page, comparing performance between two versions will provide direct insight into what resonates with your audience. Document the outcomes and iterate based on data-driven insights.
| Test Element | Version A | Version B | Conversion Rate |
|---|---|---|---|
| CTA Button Color | Blue | Green | 12% vs 18% |
| Landing Page Layout | Single Column | Multi-Column | 15% vs 22% |
Take Action and Adjust
With insights gathered, it’s time to take actionable steps. This might mean reallocating resources to high-performing content or refining underwhelming campaigns. Always be prepared to pivot your strategy based on what the data reveals. Remember, the digital landscape is ever-changing; staying agile is key to long-term success.
Regularly Review and Revise
Creating a culture of continuous improvement is vital. Schedule regular reviews of your KPI data—monthly or quarterly updates can work wonders. This rhythm keeps you aligned with your goals and allows for timely adjustments. Use these sessions to celebrate successes and address any areas needing attention, ensuring your strategy remains relevant and impactful.
Frequently Asked Questions (FAQ)
Q: What is a Website KPI?
A: A Website KPI, or Key Performance Indicator, is a measurable value that helps you assess how effectively your website is achieving its key business objectives. Think of it as a scorecard for your site—it shows you what’s working, what’s not, and where to focus your efforts for improvement.
Q: Why should I care about tracking KPIs for my website?
A: Great question! Tracking KPIs is crucial because it provides actionable insights. By understanding how users interact with your website, you can make informed decisions that lead to better user experiences, higher conversions, and ultimately, more revenue. Ignoring KPIs is like sailing without a compass—you might get somewhere, but it’s unlikely to be where you want to go!
Q: Which KPIs should I track for my website?
A: The KPIs you track can depend on your specific goals, but some must-haves include:
- Traffic Sources: Know where your visitors are coming from—social media, search engines, or direct visits.
- Bounce Rate: This tells you the percentage of visitors who leave your site after viewing only one page. A high bounce rate might indicate a problem with your content or layout.
- Conversion Rate: This is the percentage of visitors who complete a desired action, like signing up for a newsletter or making a purchase.
- Average Session Duration: This shows how long users are staying on your site. More time usually signals engaging content!
- Page Load Time: A fast-loading site enhances user experience and can boost your SEO.
Q: How often should I review these KPIs?
A: It’s a good idea to review your KPIs regularly—monthly for high-level metrics and weekly for more specific goals or campaigns. This way, you’ll be agile enough to adapt your strategy if something isn’t working as expected.
Q: Can I track these KPIs myself?
A: Absolutely! Many tools can help you track your website KPIs, such as Google Analytics, SEMrush, or even simpler platforms like HubSpot. They provide user-friendly dashboards that make it easy to monitor your performance and gather insights.
Q: What if the KPIs I’m tracking aren’t showing the results I want?
A: If your KPIs aren’t aligned with your goals, it might be time to revisit your strategy. Analyze the data to identify where visitors are dropping off or what content isn’t resonating. Then, make adjustments—whether it’s improving your site’s usability, enhancing your content, or refining your marketing tactics.
Q: Any final tips for tracking KPIs effectively?
A: Sure! Start with a few key metrics that align closely with your business goals. Avoid getting overwhelmed by data. Focus on what truly matters, and don’t hesitate to adjust your KPIs as your site evolves. Remember, the ultimate goal is to enhance user experience and drive results, so keep your users in mind!
If you’re ready to take your website to the next level, tracking KPIs is an essential step. Dive in, monitor your metrics, and let the data guide you to success!
Concluding Remarks
As we wrap up our exploration of website KPIs, it’s clear that understanding and tracking the right metrics can make all the difference in achieving your online goals. Remember, KPIs are not just numbers; they’re insights that guide your decisions, helping you refine your strategies and ultimately enhance your website’s performance.
So, whether you’re focusing on boosting traffic, improving engagement, or increasing conversions, take the time to identify which KPIs resonate most with your objectives. Start small, track consistently, and don’t be afraid to adjust your approach as you learn more about your audience and their behaviors.
By keeping a close eye on your website’s performance, you’re not just measuring success—you’re creating a path toward it. So, roll up your sleeves, dive into the data, and watch your website flourish! After all, the right KPIs can turn your digital presence from just a webpage into a powerful tool for growth. Happy tracking!