Are you pouring your heart and soul into your blog but still feeling like something’s missing? You’re not alone! Many bloggers, whether seasoned pros or enthusiastic newcomers, grapple with the challenge of turning their passion into a successful strategy. The good news? The answer lies in the numbers. Welcome to our comprehensive “Blog Analytics Guide: How to Use Data to Improve Your Strategy.”
In this article, we’ll dive into the world of blog analytics—unpacking the crucial metrics that can guide your content decisions and turbocharge your growth. From understanding your audience’s behavior to optimizing your posts for maximum engagement, we’ll show you how to transform raw data into actionable insights. So grab a cup of coffee, get comfy, and let’s unlock the potential of your blog together! Your next big breakthrough is just a click away.
Understanding the Basics of Blog Analytics
When diving into the world of blog analytics, it’s essential to grasp the foundational concepts that will guide your analysis. At its core, blog analytics refers to the collection, measurement, and analysis of data related to your blog’s performance. Understanding this data allows you to tailor your content strategy, ensuring you’re meeting the needs of your audience effectively.
One of the primary metrics you’ll encounter is traffic. This metric indicates how many visitors are landing on your blog and can be segmented into various categories, such as:
- Unique Visitors: The number of distinct users visiting your blog.
- Page Views: The total number of pages viewed, including repeat visits.
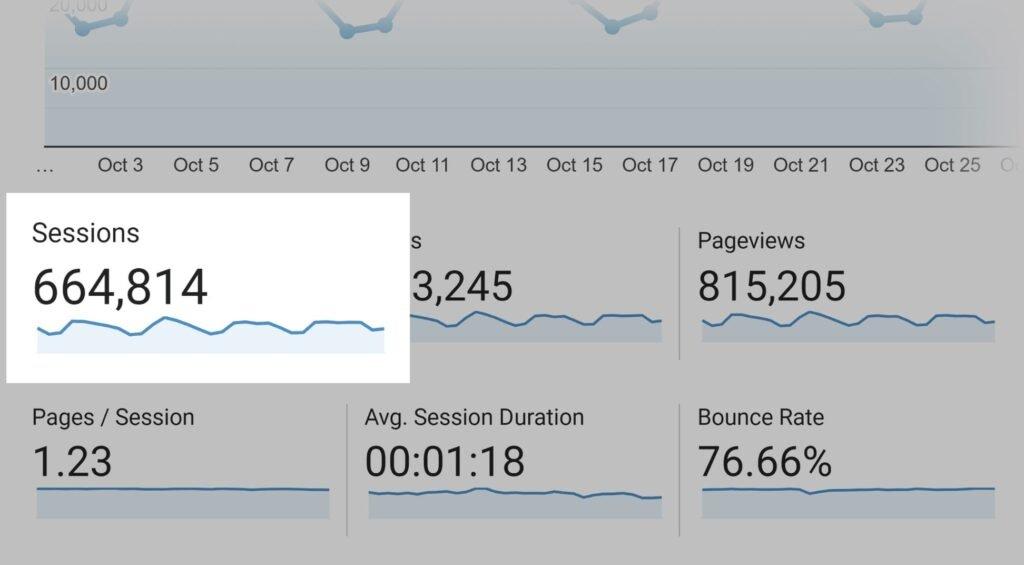
- Sessions: A session is a group of interactions a user takes within a given time frame.
Another crucial aspect to consider is engagement metrics. These include metrics that measure how users interact with your content. High engagement levels often indicate that your blog is resonating with readers. Key engagement metrics include:
- Average Time on Page: The amount of time users spend on individual posts.
- Bounce Rate: The percentage of visitors who leave your site after viewing just one page.
- Comments and Shares: The volume of interaction your posts receive on social media and directly on your blog.
Analyzing these metrics can reveal valuable insights. For instance, if you notice a high bounce rate on specific posts, it might indicate that the content is not aligning with user expectations. You can take this feedback to refine your blog topics or improve content quality. Conversely, posts with high average time on page suggest that visitors find the content engaging, which is a good sign of effective communication.
Furthermore, understanding your audience demographics is essential for better targeting. By analyzing data such as:
- Geographic Location: Where your readers are coming from.
- Age and Gender: Basic demographic segments to tailor your voice and topics.
- Interests: What other topics your audience engages with online.
you can create more personalized and relevant content. This level of targeting increases the likelihood of generating loyal readers who repeatedly visit your blog.
Additionally, a comprehensive understanding of your traffic sources will help you identify where your audience is coming from. Is it organic search, social media, or referrals from other websites? To illustrate this, consider the following table:
| Traffic Source | Percentage of Total Traffic |
|---|---|
| Organic Search | 60% |
| Social Media | 25% |
| Direct Traffic | 10% |
| Referrals | 5% |
By focusing on these traffic sources, you can prioritize your marketing efforts. For example, if organic search drives the majority of your traffic, optimizing for SEO should be a top priority. On the other hand, if social media is a significant driver, you might want to invest more time in social media marketing strategies.
blog analytics is not just about numbers; it’s about understanding the story behind those numbers. By leveraging these insights, you can continuously improve your content strategy, foster deeper connections with your audience, and ultimately enhance your blog’s success.
Why Data-Driven Decisions Matter for Your Blog
In the world of blogging, intuition and creativity are essential, but they are not enough on their own. Data-driven decisions empower you to understand your audience better, optimize your content, and ultimately drive more traffic to your blog. By leveraging analytics, you can transform vague assumptions into concrete strategies that yield measurable results.
When you dive into the world of blog analytics, you gain valuable insights into:
- Audience Behavior: Understand who your readers are, what they enjoy, and how they interact with your content.
- Content Performance: Identify which posts resonate most with your audience, allowing you to replicate that success.
- Traffic Sources: Discover where your visitors are coming from—be it search engines, social media, or referrals—and optimize those channels.
One of the most powerful aspects of using data is the ability to track trends over time. For instance, analyzing the performance of your blog posts month after month can reveal patterns in your audience’s interests. You might find that certain topics spike in popularity during specific seasons, guiding your content calendar and ensuring you’re always relevant.
Moreover, data helps you make informed decisions about your promotional strategies. If your analytics show that your audience predominantly engages with your content on social media, you can allocate more resources to those platforms. Consider the following table that illustrates potential traffic sources and their effectiveness:
| Traffic Source | Engagement Rate (%) | Conversion Rate (%) |
|---|---|---|
| Social Media | 75 | 5 |
| Search Engines | 60 | 10 |
| Email Marketing | 50 | 15 |
| Referrals | 30 | 3 |
Additionally, A/B testing is a fantastic way to leverage data for optimizing your blog. By experimenting with different headlines, images, or even call-to-action buttons, you can see what resonates most with your audience. This iterative process, informed by data, leads to continuous improvement and ensures that your blog evolves in tandem with your readers’ preferences.
being data-driven fosters a culture of accountability. By regularly reviewing your metrics and aligning them with your goals, you create a clear roadmap for success. You can set benchmarks and celebrate milestones, making your blogging journey not just about creativity, but about growth and achievement.
Key Metrics Every Blogger Should Monitor
Monitoring the right metrics is crucial for any blogger wanting to enhance their strategy and boost engagement. Having access to quality analytics can provide valuable insights into your audience’s behavior, helping you make informed decisions that drive success.
Here are some key metrics every blogger should keep a close eye on:
- Traffic Sources: Understanding where your visitors come from is essential. Are they landing on your blog via social media, search engines, or direct visits? Analyzing this data allows you to focus your promotional efforts on the most effective channels.
- Page Views: Tracking the number of page views helps you identify your most popular content. Take note of which posts attract the most traffic and consider creating similar content to maintain or increase that interest.
- Average Time on Page: This metric reveals how engaging your content is. If visitors are spending a short amount of time on your pages, it may be time to revise your writing style or content format to retain their attention.
- Bounce Rate: A high bounce rate indicates that visitors are leaving your site without exploring further. Aim to lower this percentage by improving the internal linking structure and enhancing the user experience.
- Conversion Rate: Whether your goal is to grow your email list or promote a product, measuring the conversion rate lets you know how well your blog persuades visitors to take action. Optimize your calls-to-action for better results.
- Social Shares: Tracking how often your posts are shared on social media provides insight into their viral potential. Content that resonates with readers and encourages them to share is a goldmine for driving traffic.
To sum it up, using the right analytics tools can transform your blogging game. Regularly review these metrics to identify trends and adjust your content strategy accordingly. You might find that trying out different headlines or formats could significantly impact reader engagement!
| Metric | What It Indicates | Why It Matters |
|---|---|---|
| Traffic Sources | Where your visitors come from | Helps focus marketing efforts |
| Page Views | Number of views per post | Identifies popular content |
| Average Time on Page | Engagement level of content | Indicates writing effectiveness |
| Bounce Rate | Percentage of single-page visits | Shows site attractiveness |
| Conversion Rate | Rate of desired actions taken | Measures success of goals |
| Social Shares | How often content is shared | Indicates viral potential |
By keeping these metrics in mind, you’ll not only improve your blog’s performance but also enhance the experience for your readers. Remember, data-driven decisions lead to more successful blogging outcomes!
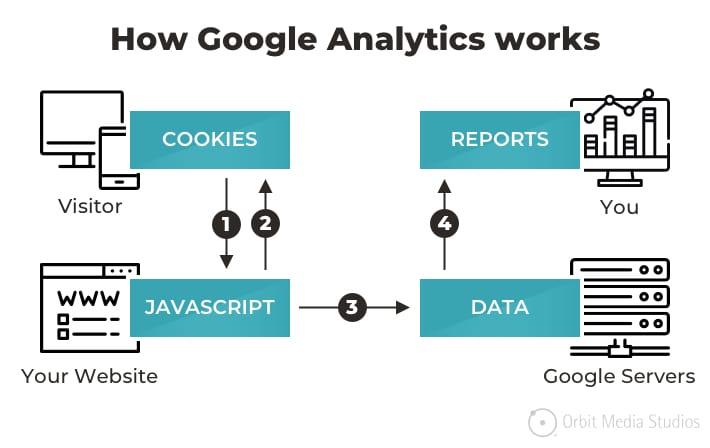
How to Set Up Google Analytics for Your Blog
Setting Up Google Analytics for Your Blog
Getting started with Google Analytics is simpler than you might think, and it’s a game-changer for understanding your blog’s performance. First things first, if you don’t already have a Google account, create one. It’s essential for accessing Google Analytics and other Google services. Once you’re signed in, follow these steps:
- Go to Google Analytics: Navigate to Google Analytics and click on “Start for free.”
- Create a Property: In your account, click on the “Admin” gear icon. Under the “Property” column, click “Create Property” and fill in your blog information.
- Set Up Data Streams: Choose “Web” as your data stream type and enter your blog’s URL. This sets up tracking for your site.
Once you create a property, you’ll be provided with a unique “Measurement ID.” This ID is crucial because it connects your blog to Google Analytics. You’ll need to implement this ID in your blog to start tracking data.
If you’re using WordPress, there are a couple of easy ways to add your Measurement ID:
- Using a Plugin: Plugins like MonsterInsights or Site Kit can simplify the process. Just install the plugin, authenticate your Google account, and enter your Measurement ID.
- Manual Method: If you prefer to add the code manually, go to your WordPress dashboard, navigate to “Appearance,” then “Theme Editor.” Find the header file (header.php) and paste your Measurement ID just before the closing tag.
Once you’ve set everything up, it’s time to verify that your data is being collected. Go back to Google Analytics and check the “Real-Time” section. Open your blog in another tab and see if your visit is being tracked. If you see data coming through, congratulations—you’re set up!
Now that you’re collecting data, consider what metrics you want to focus on. Here’s a quick table to help you prioritize your analytics goals:
| Metric | What It Tells You |
|---|---|
| Page Views | How many times your pages have been viewed. |
| Bounce Rate | The percentage of visitors who leave after viewing only one page. |
| Average Session Duration | The average time visitors spend on your blog. |
| Traffic Sources | Where your visitors are coming from (search engines, social media, etc.). |
With your data now flowing, start using these insights to refine your blog strategy. Analyze which content resonates most with your audience, and consider creating more of that type. Monitor traffic sources to see where you should focus your promotional efforts. By leveraging Google Analytics, you’re not just guessing anymore; you’re making informed decisions that will elevate your blogging game.
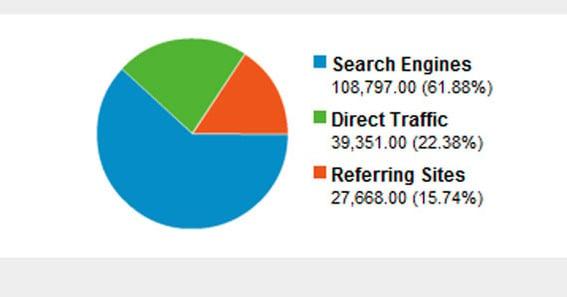
Interpreting Your Traffic Sources for Better Insights
Understanding where your traffic comes from is crucial for optimizing your blog strategy. By diving into your traffic sources, you can glean insights that drive more effective content creation and marketing efforts. Here’s how to interpret those sources for better decision-making.
First, categorize your traffic sources into a few main types:
- Organic Search: Visitors coming from search engines like Google. This indicates how well your SEO is performing.
- Direct Traffic: Users who type your URL directly into their browser or use bookmarks. A high percentage suggests strong brand recognition.
- Referral Traffic: Visitors from other websites that link back to yours. This can help you identify partnerships and effective backlinks.
- Social Media: Traffic generated from platforms like Facebook, Twitter, and Instagram. This shows how well you’re engaging your audience on social channels.
- Email Campaigns: Visitors coming from your newsletters or promotional emails. This highlights the effectiveness of your email marketing efforts.
Next, it’s important to analyze the quality of traffic from these sources. Not all traffic is created equal. Look at metrics such as Bounce Rate, Average Session Duration, and Pages per Session to assess user engagement:
| Traffic Source | Bounce Rate | Average Session Duration | Pages per Session |
|---|---|---|---|
| Organic Search | 45% | 3:45 | 4.2 |
| Direct Traffic | 30% | 5:00 | 5.0 |
| Referral Traffic | 50% | 2:30 | 3.0 |
| Social Media | 60% | 1:50 | 2.0 |
| Email Campaigns | 35% | 4:10 | 4.5 |
After identifying which sources yield high-quality traffic, you can refine your strategy. For instance, if you notice that organic search has a low bounce rate and high session duration, it’s a clear indication that your SEO efforts are working. Consider creating more content around similar topics or keywords that draw in this audience.
Conversely, if your social media traffic shows a high bounce rate and low engagement, it may be time to re-evaluate your content strategy on those platforms. Are you sharing valuable content that resonates with your followers? Are your posts driving traffic effectively? Experiment with different types of posts – videos, infographics, or polls – to find what keeps your audience engaged.
Lastly, don’t forget the importance of conversion tracking. Knowing which traffic sources lead to the most conversions can help you allocate your resources wisely. Whether you’re aiming for sign-ups, downloads, or purchases, setting up goals in your analytics tool will help you measure the success of your campaigns and understand where to focus your efforts next.

Unpacking Audience Behavior: What Readers Really Want
Understanding your audience is crucial for any successful blog. By unpacking audience behavior, you can tailor your content to meet their needs and preferences. Here are some key insights into what readers really want:
- Value-driven Content: Readers are constantly on the lookout for information that can help them solve problems or enrich their lives. If your posts provide actionable tips or insightful analysis, they are more likely to engage and share.
- Authenticity: Today’s readers crave genuine voices. They want to connect with real people behind the content. Share personal stories or invite guest contributors to bring fresh perspectives and diversify your voice.
- Visual Appeal: A visually pleasing layout can significantly enhance reader experience. Use images, infographics, and videos to break up text and illustrate your points effectively.
- Interactive Elements: Incorporating quizzes, polls, or comment sections encourages readers to engage more deeply with your content. This not only boosts interaction but also provides you with valuable feedback on their preferences.
But how can you uncover these preferences? Start by diving into your blog analytics. Look for patterns in:
| Metric | What It Reveals |
|---|---|
| Page Views | Identifies popular topics and content types. |
| Average Time on Page | Indicates reader engagement and interest level. |
| Bounce Rate | Shows how effectively your content retains visitors. |
| Comments and Shares | Highlights what resonates with your audience. |
By analyzing these metrics, you can make informed decisions about future content. For example, if you notice that readers spend more time on listicles, consider creating more posts in that format. Similarly, if certain topics spark lively discussions in the comments, explore those themes further to foster community engagement.
Another powerful strategy is to segment your audience. Different demographics may have varying interests and preferences. By creating tailored content for specific groups, you can increase relevance and connection. Use data from social media insights and email campaigns to inform these segments.
don’t forget to ask your audience directly! Conduct surveys or polls to gain deeper insights into their preferences. This not only shows your readers that their opinions matter but also helps you refine your content strategy based on their needs.
Using Engagement Metrics to Craft Compelling Content
In the world of blogging, understanding your audience’s preferences is crucial, and engagement metrics serve as the compass guiding your content creation. By analyzing these metrics, you can tailor your content to resonate more powerfully with your readers.
Start by focusing on the following key engagement metrics:
- Page Views: A foundational metric that tells you how many times your content has been accessed.
- Time on Page: This indicates how engaged readers are with your content; the longer they stay, the more compelling the content likely is.
- Bounce Rate: A high bounce rate may suggest that your content isn’t meeting the expectations of your audience.
- Social Shares: Tracking how often your content is shared can reveal its perceived value and relevance among your audience.
Once you have a solid grasp of these metrics, it’s time to put them into action. For instance, if a specific post has a high time on page but a low number of shares, it might mean that while readers find value in the content, they aren’t compelled to share it. This could be an opportunity to enhance your call-to-action or integrate more shareable elements, like visually appealing graphics or quotes.
Another strategy is to analyze the performance of different content formats. For example, if you notice that listicles or infographics are generating more engagement compared to standard articles, consider shifting your focus toward these formats. You might even run A/B tests on your headlines to see which style resonates more with your audience.
The key to creating content that resonates lies in understanding your audience’s journey. Utilizing tools like Google Analytics can reveal where readers are dropping off in your content. Armed with this information, you can refine your content structure, ensuring that each section leads seamlessly into the next, keeping readers engaged until the very end.
Don’t forget to solicit feedback directly from your audience. Use polls or comment sections to ask readers what they’d like to see more of. This not only increases engagement but also gives you direct insights into their preferences, allowing you to cater your content strategy accordingly.
| Engagement Metric | Actionable Insight |
|---|---|
| High Page Views | Consider creating similar topics to capitalize on interest. |
| Low Time on Page | Revise the content to make it more engaging or visually appealing. |
| High Bounce Rate | Reassess your headlines and introductory paragraphs to ensure they align with expectations. |
| Low Social Shares | Enhance your calls-to-action and incorporate shareable content elements. |
Ultimately, the goal is to create content that not only attracts visitors but also captivates and retains them. By leveraging engagement metrics effectively, you will not only enhance your content strategy but also cultivate a loyal readership that returns for more.
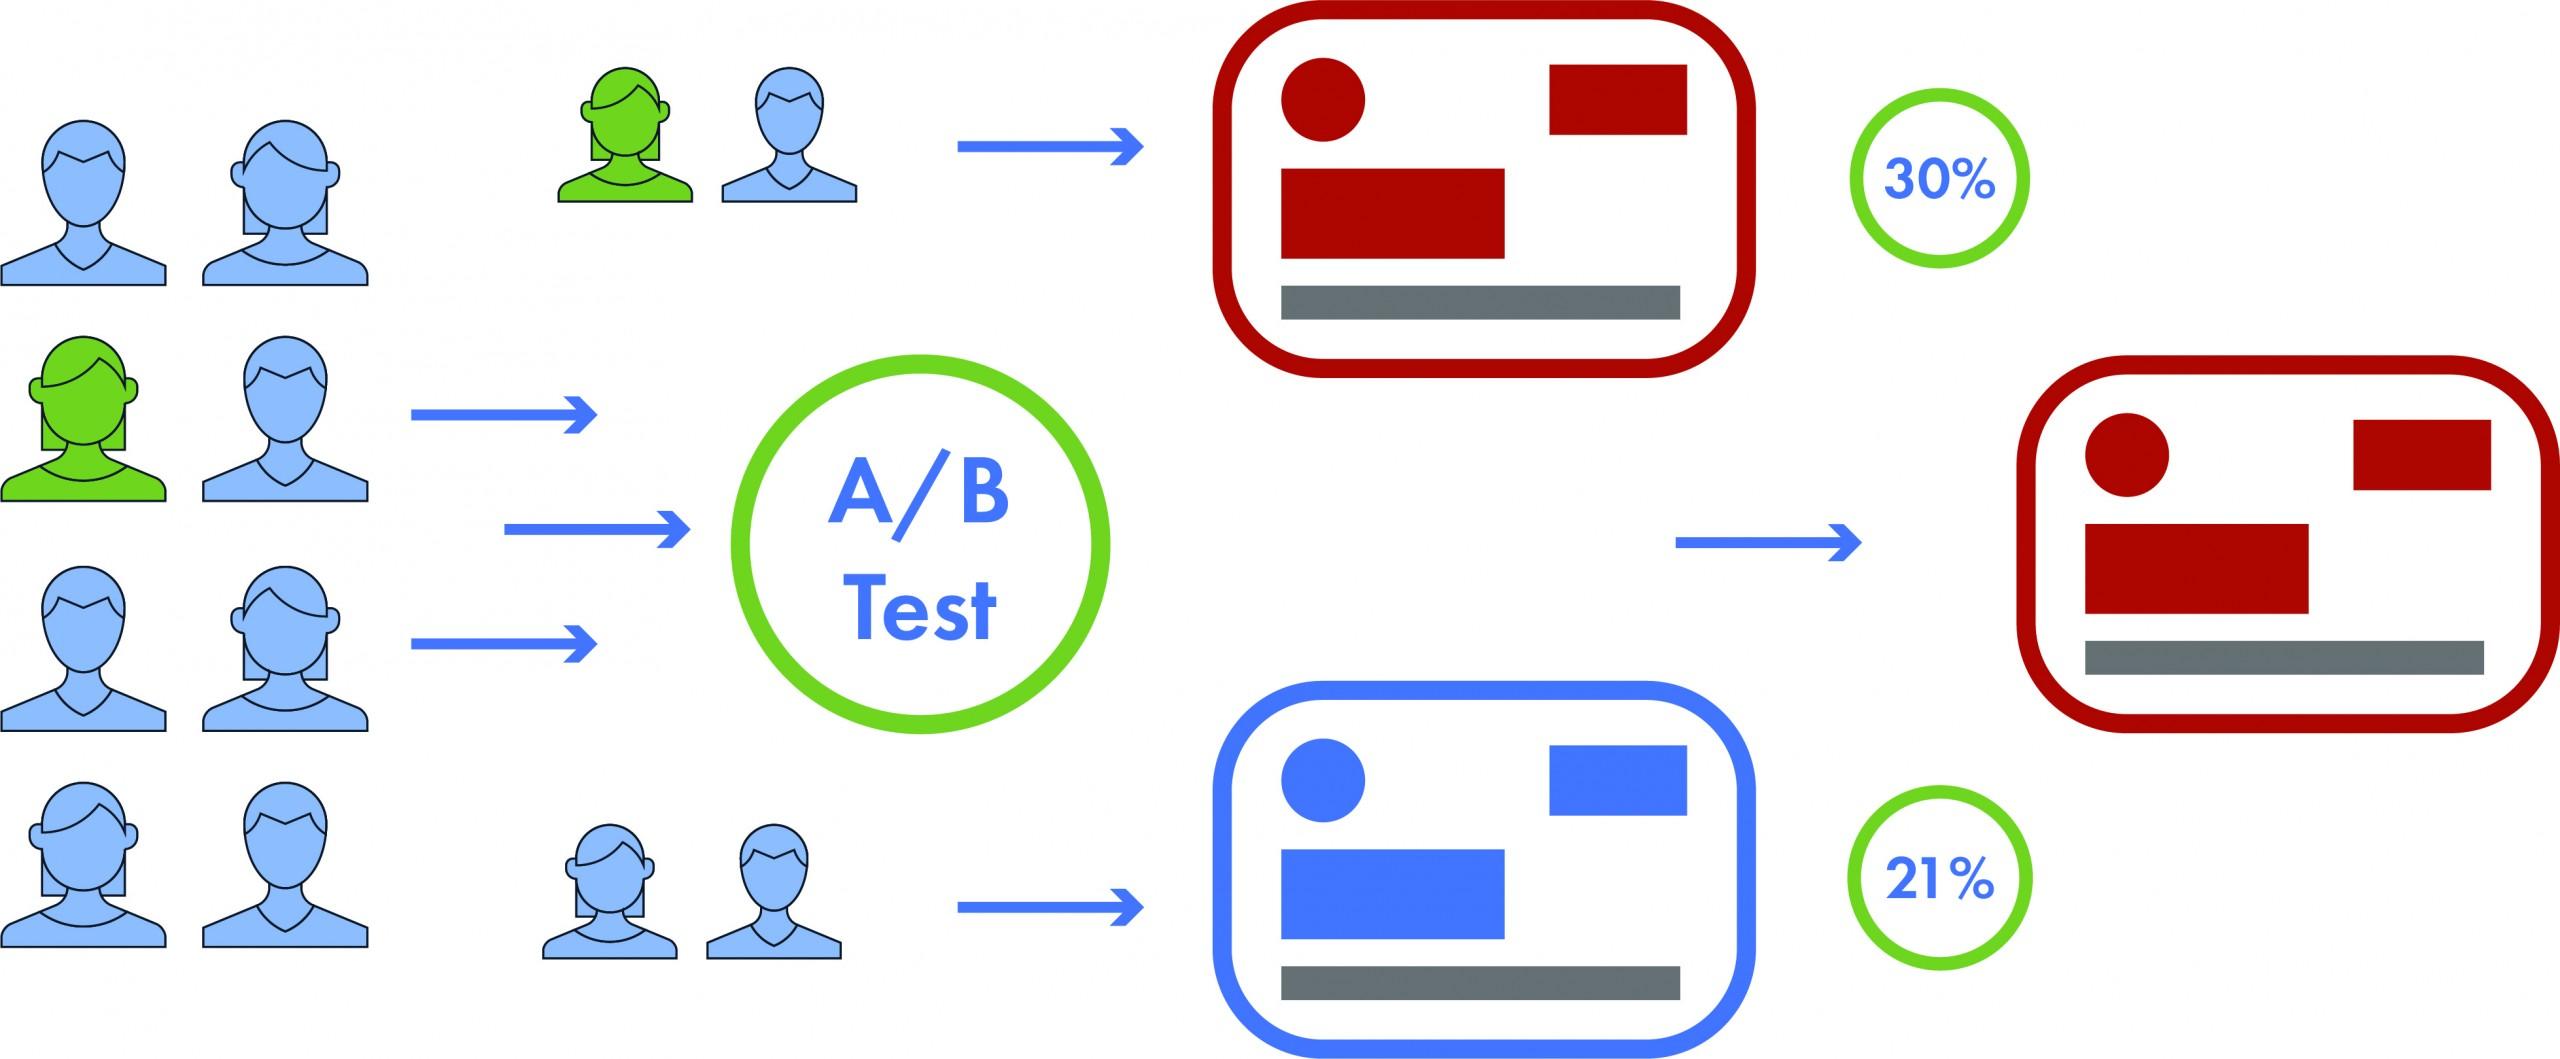
Leveraging A/B Testing to Optimize Your Posts
When it comes to enhancing your blog’s reach and engagement, A/B testing stands out as an invaluable tool. This method involves creating two variations of a post and measuring their performance to determine which one resonates more with your audience. By harnessing the power of data-driven decisions, you can refine your content strategy effectively.
Here’s how to make A/B testing work for you:
- Identify Your Goal: Determine what you want to achieve with your post. Is it higher engagement, more comments, or increased shares?
- Choose Your Variables: Focus on specific elements to test. Common variables include headlines, images, call-to-action (CTA) buttons, and post formats.
- Split Your Traffic: Use tools like Google Optimize or WordPress plugins to evenly distribute traffic between your two versions. Aim for a significant sample size to get reliable results.
- Analyze the Results: After a predetermined period, compare the metrics. Look at click-through rates, bounce rates, and social shares to see which version performed better.
- Iterate Based on Findings: Once you identify the winner, implement the successful elements into your future posts and continue testing new variables.
Testing different headlines can yield surprising insights. For instance, consider the impact of emotional language versus straightforward headlines. You might find that a catchy, emotionally charged headline drives more traffic, while a concise, factual option fosters deeper engagement.
Another critical factor to explore is the placement and design of your CTAs. A/B testing can reveal whether a prominent button at the top of the post outperforms a subtler link within the content. Perhaps a vibrant color draws more clicks than a muted tone. Adjust your designs based on what the data suggests.
To illustrate the effectiveness of A/B testing, consider the following table showcasing hypothetical results from two variations of a blog post:
| Element Tested | Version A | Version B |
|---|---|---|
| Headline | 5,000 views, 300 shares | 6,500 views, 450 shares |
| CTA Placement | 4% click-through rate | 6% click-through rate |
As the table illustrates, Version B outperformed Version A in both views and shares, emphasizing the importance of testing your content variations. By continuously experimenting and analyzing results, you can adapt your strategies to better align with your audience’s preferences.
Ultimately, A/B testing is not a one-time effort but a recurring component of your blogging strategy. Regularly testing and optimizing your posts based on real user data will not only enhance your reach but also foster a deeper connection with your audience, ensuring that your content remains relevant and engaging.
Identifying Trends and Patterns in Your Data
Understanding your blog’s performance is more than just tracking clicks and views; it’s about uncovering the trends and patterns that tell a deeper story about your audience’s behavior. By analyzing your data, you can identify what resonates with your readers and what doesn’t, which can guide future content creation and marketing strategies.
Start by looking at your website’s traffic sources. Are visitors primarily coming from social media, search engines, or direct links? Each source can indicate different audience engagement levels and preferences:
- Social Media: High engagement on platforms like Instagram or Twitter may suggest a visually appealing or conversational style resonates well.
- Search Engines: If a significant portion of your traffic comes from search, focus on SEO strategies and keyword optimization to maintain or increase visibility.
- Direct Links: This often indicates a loyal audience, suggesting that your existing content is compelling enough to encourage repeat visits.
Next, dive into your content performance. Utilize analytics tools to measure which posts attract the most views and engagement. Pay attention to metrics such as average time on page, bounce rate, and social shares. Look for patterns in successful articles:
- Are listicles performing better than traditional articles?
- Do longer, in-depth pieces drive more traffic compared to shorter posts?
- What topics generate the most comments and shares?
Consider creating a simple comparison table to visualize your findings. A table can help highlight the performance of different posts at a glance:
| Post Title | Views | Average Time on Page | Bounce Rate |
|---|---|---|---|
| 10 Tips for Better Blogging | 1,200 | 4:30 | 45% |
| SEO Basics You Should Know | 900 | 3:15 | 60% |
| How to Monetize Your Blog | 1,500 | 6:00 | 30% |
Once you identify trends, it’s essential to connect the dots between your data and your overall goals. For instance, if longer articles drive lower bounce rates and higher engagement, it may be worthwhile to focus your efforts on creating more extensive, valuable content. Conversely, if certain topics continuously underperform, consider revamping those or exploring new angles that could spark interest.
Don’t forget about the significance of audience segmentation. By analyzing the behavior of different demographic groups, you can tailor your content strategy more effectively. Are younger readers engaging more with certain topics than older ones? Or perhaps women are more likely to share specific articles than men? Targeted content based on these insights can lead to improved engagement and a stronger connection with your audience.
remember that trend analysis is an ongoing process. Regularly revisit your analytics to understand how seasonal changes, current events, or shifts in audience behavior impact your data. By staying adaptive and responsive to the trends you identify, you can continuously refine your content strategy, ensuring it remains relevant and effective.

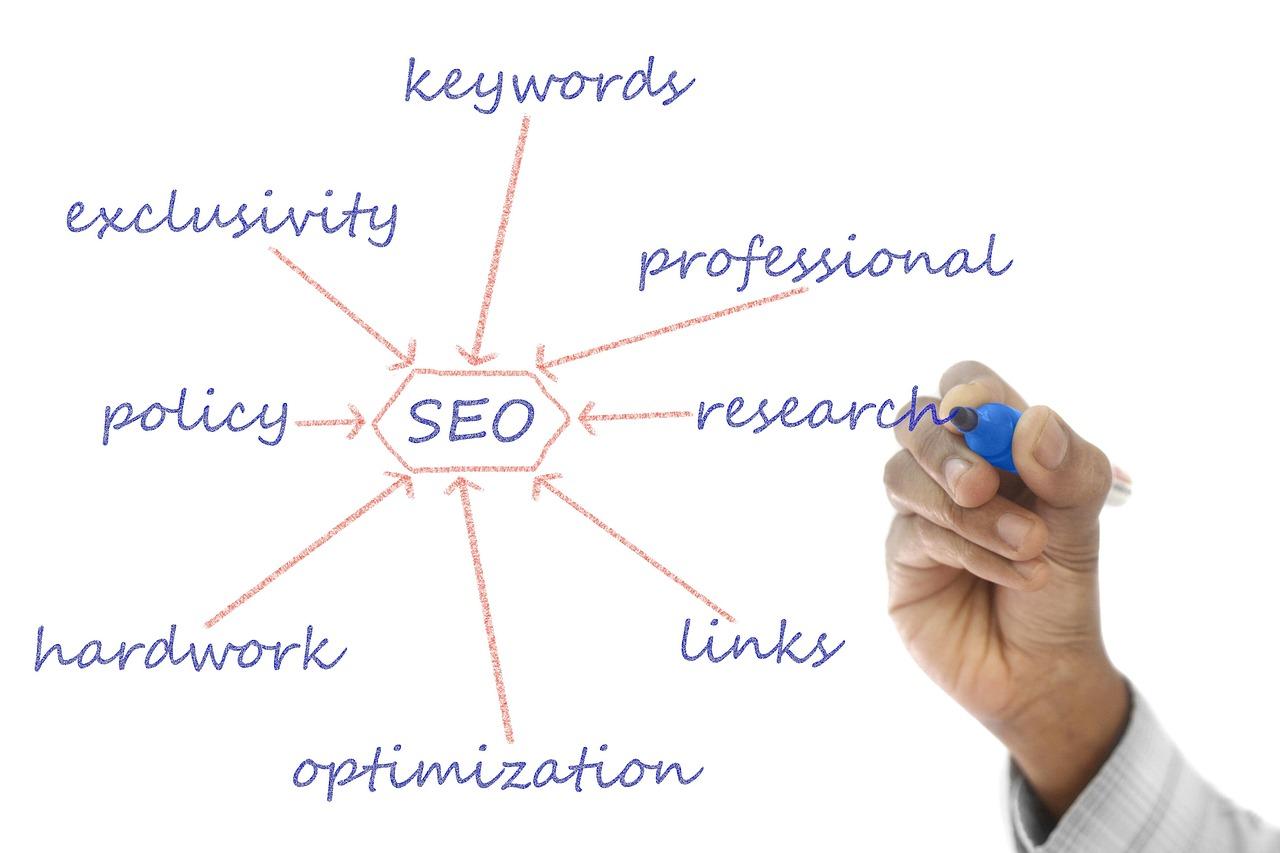
The Role of SEO in Your Blog Analytics Strategy
When it comes to maximizing the effectiveness of your blog analytics strategy, SEO plays a pivotal role. By understanding how search engine optimization influences your blog’s performance, you can leverage data to fine-tune your content, ultimately leading to enhanced visibility and engagement.
First and foremost, the intersection of SEO and analytics allows you to pinpoint which keywords drive traffic to your blog. By using tools like Google Analytics and Google Search Console, you can:
- Identify high-performing keywords: Discover which terms resonate with your audience and bring in organic traffic.
- Analyze click-through rates (CTR): Understand how well your titles and meta descriptions attract clicks.
- Track user behavior: See how visitors interact with your content once they arrive, helping you optimize for their needs.
Moreover, incorporating SEO data into your blog analytics strategy can help you identify content gaps. By examining which topics are trending in your niche but underrepresented on your blog, you can create posts that fill these gaps, ensuring you remain relevant and engaging to your audience. This approach not only attracts new readers but also retains existing ones.
Another key aspect of SEO in your analytics strategy is the performance of your backlinks. Analyzing which external sites link to your blog can offer insights into your site’s credibility and authority. Here’s how you can use this information:
- Build relationships: Identify sites that frequently link to you and nurture these connections for future collaborations.
- Enhance content quality: Aim to produce higher-quality content that encourages more backlinks from authoritative sites.
Furthermore, it’s essential to keep track of your site speed and mobile-friendliness, both of which are crucial ranking factors. Use your analytics tools to monitor load times and user experience across devices. A slow or poorly optimized site can significantly deter visitors, leading to higher bounce rates that can adversely affect your rankings.
creating a feedback loop between SEO and your analytics strategy means you’ll continually adapt and evolve your blog based on data-driven insights. Regularly review your analytics to see the impact of your SEO efforts, adjusting your strategy as necessary. As a best practice, consider maintaining a simple table to compare past and current performance metrics:
| Metric | Last Month | This Month |
|---|---|---|
| Organic Traffic | 1,200 | 1,500 |
| Average CTR | 2.5% | 3.1% |
| Bounce Rate | 60% | 45% |
integrating SEO into your blog analytics strategy is not just about improving traffic; it’s about creating a sustainable and engaging blog experience. By using data to inform your SEO efforts, you can ensure that your content not only attracts visitors but also keeps them coming back for more.
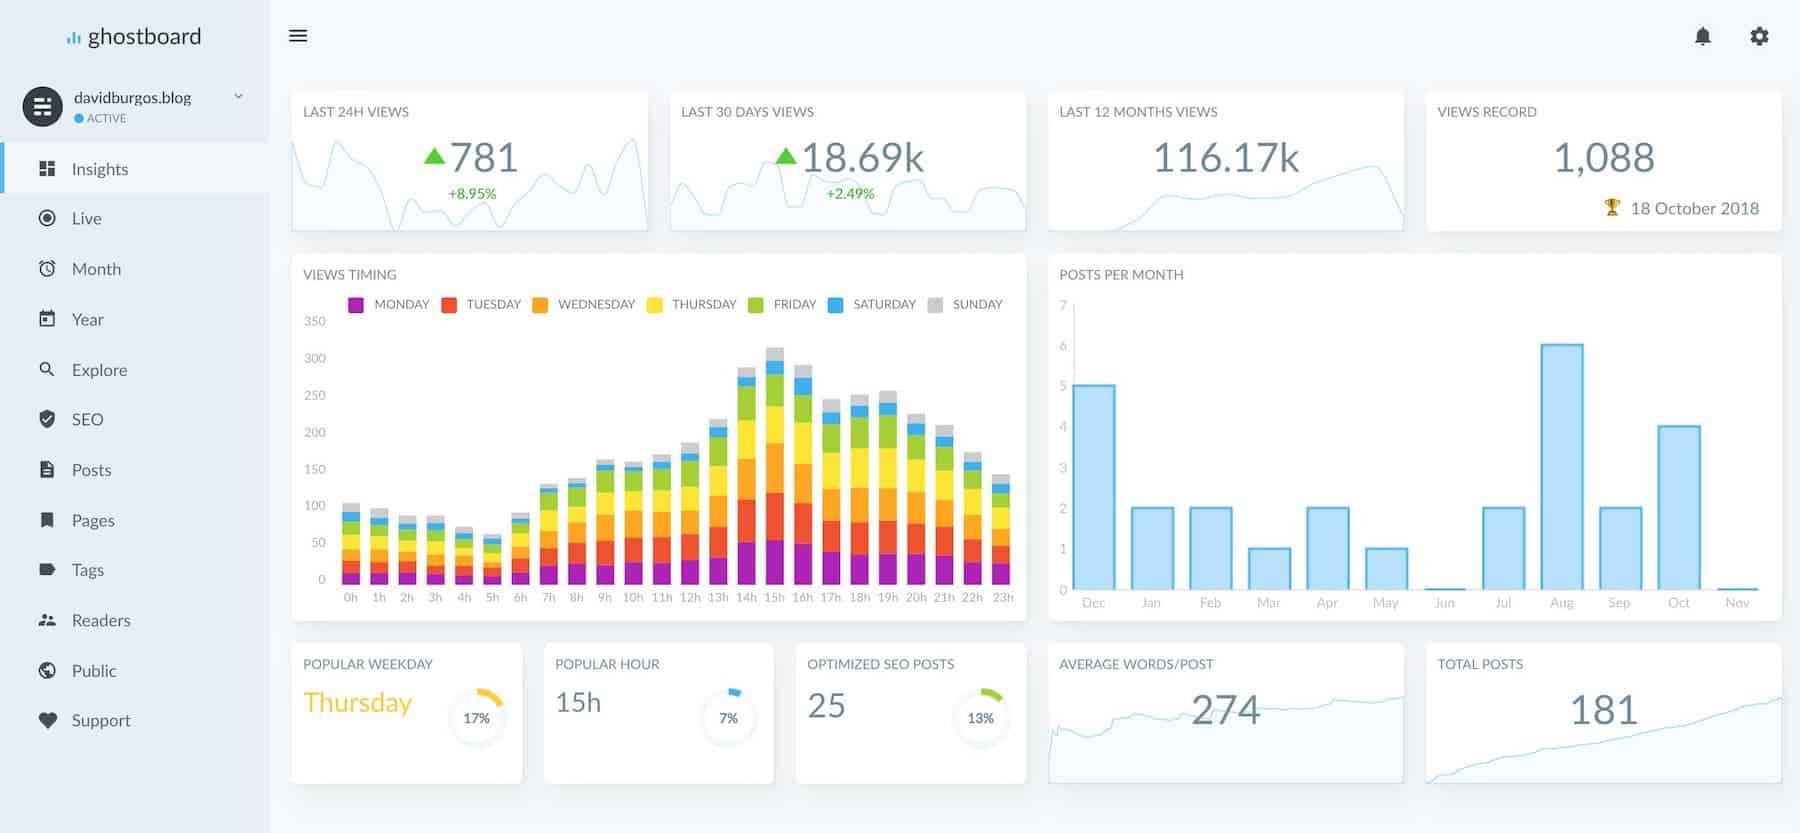
Creating a Simple Dashboard to Track Your Progress
Creating a dashboard to track your progress can be a game-changer in your blog analytics journey. The beauty of a well-structured dashboard lies in its ability to provide you with real-time insights at a glance, making it easier to make informed decisions that align with your overall strategy.
Start by determining the key metrics that matter most to your blog’s success. Focus on metrics such as:
- Page Views: Understand which content draws the most visitors.
- Unique Visitors: Track how many individual users are engaging with your site.
- Bounce Rate: Analyze what percentage of visitors leave without any interaction.
- Conversion Rate: Measure how many visitors are completing desired actions, like signing up for a newsletter.
- Social Shares: See how often your content is shared across platforms.
Once you’ve identified these metrics, consider using a tool like Google Data Studio or a simple spreadsheet to visualize your data. Visual representations can help to quickly identify trends and areas for improvement. For instance, incorporating line graphs for page views over time can illuminate growth patterns or seasonal dips in traffic.
Set up your dashboard with clear sections for each metric. This organization allows for easy navigation and quick insights. A sample layout could look like this:
| Metric | Current Value | Goal | Change from Last Month |
|---|---|---|---|
| Page Views | 1,200 | 1,500 | +15% |
| Unique Visitors | 950 | 1,200 | +10% |
| Bounce Rate | 50% | 40% | -5% |
Make sure to update your dashboard regularly—daily or weekly, depending on your traffic levels. By keeping your data fresh, you can swiftly react to changes and adapt your content and marketing strategies accordingly. It’s about creating a feedback loop that fosters continuous improvement.
don’t hesitate to share your findings with your team or community. Engaging in discussions about your analytics can provide new perspectives and ideas for enhancing your blog strategy. Whether it’s brainstorming content topics that resonate or identifying promotional tactics that yield better engagement, collaboration can bring about innovative solutions.

Turning Insights into Action: Making Data Work for You
In today’s digital landscape, data is more than just numbers; it’s a treasure trove of insights waiting to be unearthed. Understanding how to leverage this information can transform your blog strategy from good to exceptional. Here’s how you can take actionable steps using blog analytics to fuel your growth.
Identify Key Metrics that matter to your goals. Not all data is created equal, and focusing on the right metrics can significantly enhance your strategy. Consider these important indicators:
- Traffic Sources: Where are your visitors coming from? This information helps tailor your promotional efforts.
- Engagement Rates: Look at how long readers stay on your posts and what content resonates with them.
- Conversion Rates: Are your visitors taking the desired actions? Tracking this can inform your call-to-action strategies.
Once you have identified your key metrics, it’s time to analyze the data. Use analytics tools like Google Analytics or WordPress plugins to gather insights. Dive deep into:
- User Behavior: Understand how visitors navigate your site. Identify the pages with the highest drop-off rates and optimize them.
- Content Performance: Determine which posts generate the most traffic and engagement. This can guide your future content creation.
- Audience Demographics: Knowing your audience is crucial. Analyze age, location, and interests to tailor your content accordingly.
After gathering insights, it’s time to implement changes. Create a plan based on your findings. Here’s a simple approach:
| Action Item | Data-Driven Insight |
|---|---|
| Optimize High Drop-Off Pages | Improve user experience and content on pages with high exit rates. |
| Create More of What Works | Replicate success by producing similar content to your most popular posts. |
| Target Specific Audience Segments | Customize posts for different demographics based on your audience data. |
Don’t forget the importance of testing and iterating. Implement A/B testing for headlines, images, or calls to action. This will help you pinpoint what resonates best with your readers. Data is not static; it evolves, and so should your strategies.
make it a habit to review your data regularly. Establish a schedule for analyzing your analytics—weekly or monthly. Consistent review ensures that you stay aligned with your audience’s interests and adapt to any shifts in behavior.

Regular Review: How Often Should You Analyze Your Data?
When it comes to analyzing your blog data, the question isn’t just about what to look for, but how often you should be looking. Regular reviews of your data can lead to invaluable insights that can help fine-tune your strategy. However, determining the right frequency for these reviews can be a bit tricky.
Consider conducting a data review on a monthly basis. This timeframe strikes a balance between capturing enough data for meaningful analysis while avoiding information overload. Monthly reviews allow you to track trends over time and adjust your strategy accordingly without feeling rushed.
For high-traffic blogs, bi-weekly assessments may be more appropriate. With a larger volume of data, you can identify shifts in audience behavior and engagement more quickly. This allows for rapid adjustments, ensuring that your content remains relevant and engaging to your audience.
On the other hand, if your blog is just starting out or sees lower traffic, consider a quarterly review. This gives you ample time to gather data and insights that reflect more stable trends, making it easier to understand your audience’s evolving preferences. A quarterly approach helps in setting longer-term goals without getting bogged down in day-to-day fluctuations.
To keep your review process organized, here are a few key metrics to focus on during each review:
- Page Views: Track which posts are attracting the most attention.
- Bounce Rate: Understand how well your content retains visitors.
- Conversion Rate: Measure how effectively your content drives desired actions.
- Engagement Metrics: Look at comments, shares, and session duration to gauge user interaction.
Additionally, set aside time to compare your results with previous periods. This can be done through a simple table to visualize your growth:
| Metric | Last Month | This Month | % Change |
|---|---|---|---|
| Page Views | 1,200 | 1,500 | +25% |
| Bounce Rate | 55% | 50% | -5% |
| Conversion Rate | 3% | 4% | +1% |
Ultimately, the frequency of your reviews should align with your specific goals and the dynamics of your audience. Regular reflection on your data not only keeps your strategy agile but also empowers you to make decisions that resonate with your readers. By maintaining a consistent review schedule, you turn data into a strategic asset that fuels your blog’s growth.
Future-Proofing Your Blog with Ongoing Analytics Evaluation
To truly harness the power of your blog, you need to think beyond just collecting data. It’s about creating a culture of ongoing evaluation that allows you to adapt, pivot, and grow. By regularly analyzing your blog’s performance metrics, you can ensure that your content strategy remains relevant and engaging for your audience.
Start by regularly monitoring key performance indicators (KPIs) that matter most to your goals. Here’s a quick list of essential metrics to keep an eye on:
- Page Views: Measure how many times your pages are viewed to understand content popularity.
- Bounce Rate: Analyze the percentage of visitors who leave after viewing only one page.
- Average Session Duration: Get insights on how long visitors are staying on your site.
- Traffic Sources: Identify where your traffic is coming from—search engines, social media, or direct visits.
- Conversion Rate: Track how many visitors complete desired actions, like signing up for a newsletter.
Using tools such as Google Analytics or specific WordPress plugins, you can set up dashboards that give you a bird’s eye view of these metrics. However, collecting data is just the beginning. The real magic happens when you dive deep into the numbers to extract actionable insights. For instance, if your traffic is high but your bounce rate is equally so, it may be time to reevaluate your content quality or the relevancy of your headlines.
Don’t forget to analyze audience demographics as well. Understanding who your readers are can drastically shift your content strategy. Consider the following:
| Demographic | Insights |
|---|---|
| Age Group | Tailor content themes that resonate with specific age demographics. |
| Geography | Use localized content to engage readers from different regions. |
| Interests | Create content categories based on popular interests among your audience. |
Additionally, set up regular review periods—monthly or quarterly—to reevaluate your analytics strategy. During these reviews, ask yourself critical questions like:
- What content types performed best? This helps you to focus on high-engagement formats.
- Are there trends in traffic sources? Shift your promotional strategies based on where traffic is peaking.
- How is seasonal or trending content impacting overall performance? Capitalize on these trends to keep your content fresh and relevant.
Lastly, remember that future-proofing your blog isn’t a one-time effort; it’s an ongoing commitment. Stay updated with the latest analytics tools and trends in the blogging industry. Engaging in webinars, forums, and online courses can keep your skills sharp and your strategies effective. By creating a feedback loop with your audience and data, you’ll not only enhance your blog’s performance but also solidify your position as an authority in your niche.
Frequently Asked Questions (FAQ)
Q&A: Blog Analytics Guide: How to Use Data to Improve Your Strategy
Q: Why should I care about blog analytics?
A: Great question! Blog analytics are like the GPS for your blogging journey. They show you where you are, where you’ve been, and where you need to go. By understanding your audience’s behavior and preferences, you can tailor your content strategy to better meet their needs, ultimately leading to increased traffic, engagement, and conversions.
Q: What key metrics should I be tracking?
A: There are several important metrics to consider! Start with page views, which indicate how many times your blog has been visited. Next, look at bounce rate—this tells you how many visitors leave after viewing just one page. Engagement metrics like average time on page and social shares show how well your content resonates with readers. Lastly, track conversion rates to see how many visitors take desired actions, like signing up for a newsletter or making a purchase.
Q: How can I use data to improve my content?
A: Data provides insight into what your audience loves! By analyzing which blog posts attract the most traffic or engagement, you can identify trends and topics that resonate. If a certain type of post—like how-tos or listicles—performs well, consider creating more content in that style. Don’t forget to pay attention to feedback in the comments! Your readers often give valuable insights that numbers alone can’t capture.
Q: Is it really worth the time to analyze data?
A: Absolutely! While it may seem daunting at first, investing time in understanding your analytics pays off. It helps you make informed decisions rather than guessing what works. Plus, seeing the impact of your adjustments can be incredibly rewarding! Just think of it as fine-tuning your strategy to resonate more with your audience, leading to a more successful blog.
Q: How often should I review my blog analytics?
A: Consistency is key! It’s wise to check your analytics at least once a month to spot trends and gauge the effectiveness of your strategies. However, if you’re running a campaign or have launched a new series of blog posts, consider reviewing data weekly. This allows you to make real-time adjustments based on what’s working or not.
Q: What tools do you recommend for tracking blog analytics?
A: There are several fantastic tools out there! Google Analytics is a must-have for comprehensive insights, and it’s free! You can also explore tools like SEMrush for SEO performance, or social media analytics tools such as Buffer or Hootsuite to track engagement on social platforms. Don’t forget to check out your blogging platform’s built-in analytics feature, too—these can be a great starting point!
Q: What if I’m not seeing the results I want?
A: Don’t get discouraged! Use your analytics to identify weak spots. Are people leaving your site quickly? That could indicate that the content isn’t engaging enough or that your headlines need a little work. Maybe your audience isn’t finding you through search engines—this might mean it’s time to refine your SEO strategy. Remember, data isn’t just numbers; it’s a roadmap to improvement!
Q: Any final tips for using analytics effectively?
A: Definitely! Focus on storytelling with your data. Don’t just look at the numbers; think about what they’re telling you about your audience’s preferences and behavior. Set specific goals based on your analytics, whether it’s increasing traffic by a certain percentage or boosting engagement. And most importantly, keep experimenting and adapting—blogging is an evolving process, and your strategy should evolve with it!
Key Takeaways
As we wrap up this journey through the world of blog analytics, remember that the power to transform your content strategy is right at your fingertips. By harnessing the insights from your data, you can make informed decisions that not only elevate your blog but also resonate deeply with your audience.
Don’t view analytics as a chore; instead, embrace it as your trusted companion in the creative process. Experiment with different strategies, keep an eye on your metrics, and don’t hesitate to pivot when the data suggests a new direction. Each click, each comment, and each share tells a story—one that can guide you toward greater engagement and growth.
So, take a deep breath and dive into those analytics tools. Your next big breakthrough could be just a few clicks away! Remember, every successful blog starts with a willingness to learn and adapt. Happy blogging, and may your data-driven decisions lead you to even greater heights!