
What Is Business Intelligence? (A Complete Guide With Examples)
In today’s fast-paced business world, data is more than just numbers on a spreadsheet; it’s the lifeblood of decision-making. But with vast amounts of information flowing in from every direction, how do companies sift through the noise to find actionable insights? That’s where Business Intelligence (BI) comes into play. Imagine having a powerful set of tools at your fingertips that not only helps you understand what’s happening in your business but also predicts future trends and guides strategic decisions. Sounds like a game-changer, right?
In this article, we’ll delve into the essentials of Business Intelligence—what it is, how it works, and why it’s crucial for any organization aiming to stay ahead of the competition. We’ll break down complex concepts into digestible pieces and provide real-world examples that illustrate BI in action. Whether you’re a seasoned executive or a budding entrepreneur, understanding BI could be the key to unlocking your business’s full potential. So, let’s embark on this journey together and discover how the right data can transform your decision-making process and propel your business to new heights!
Understanding Business Intelligence and Its Importance
Business Intelligence (BI) is a powerful framework that combines technology, processes, and data analysis to help organizations make informed decisions. In today’s fast-paced market, having the right information at the right time is crucial for success. BI tools enable businesses to transform raw data into meaningful insights, driving strategic decisions and enhancing operational efficiency.
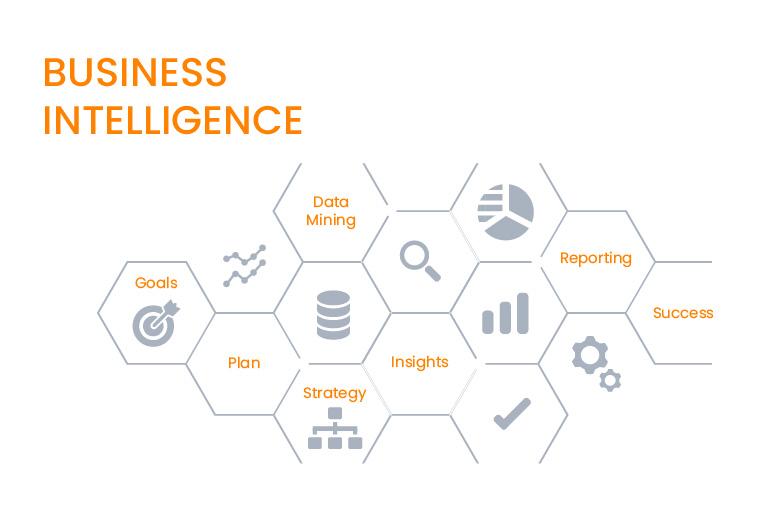
At its core, BI encompasses a range of activities, including data mining, reporting, performance benchmarking, and predictive analytics. These elements work together to provide a comprehensive view of business performance. Here’s why understanding BI is essential:
- Data-Driven Decisions: BI allows organizations to base their strategies on data rather than intuition. By analyzing past trends, companies can forecast future outcomes and make proactive choices.
- Improved Efficiency: With BI tools, businesses can streamline operations. By identifying inefficiencies and areas of improvement, organizations can optimize their resources and save costs.
- Competitive Advantage: Companies utilizing BI are better equipped to understand market trends and customer preferences, giving them an edge over competitors who rely solely on traditional methods.
- Enhanced Collaboration: BI promotes a culture of sharing information across departments. This collaborative approach ensures that all team members are aligned with the company’s goals and objectives.
Implementing a robust BI strategy involves several key components. These include data collection, storage, analysis, and dissemination. The process typically starts by gathering data from various sources—whether internal systems, third-party applications, or social media platforms. This data is then stored in a centralized repository such as a data warehouse, making it accessible for analysis.
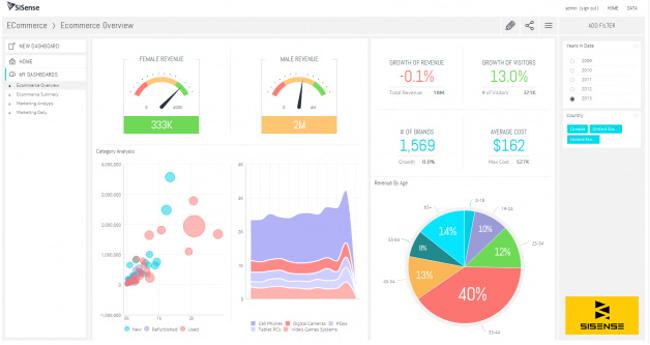
Once stored, BI tools apply analytical techniques to draw insights. These insights can be visualized through dashboards and reports, simplifying complex data into digestible formats. Organizations can track key performance indicators (KPIs) and other metrics that matter most to their success. Here’s a simple example of a dashboard layout:
| Metric | Current Value | Change from Last Month |
|---|---|---|
| Monthly Revenue | $50,000 | +10% |
| Customer Retention Rate | 85% | -2% |
| New Customers | 200 | +15% |
However, simply having data is not enough. Organizations must cultivate a data-driven culture where employees are encouraged to utilize these insights in their daily tasks. Training and support are vital in ensuring that all staff members feel comfortable using BI tools and interpreting data correctly.
the importance of Business Intelligence cannot be overstated. It equips businesses with the tools necessary to navigate complex market dynamics, understand consumer behavior, and ultimately drive growth. By leveraging BI effectively, organizations can ensure they remain agile and competitive in an ever-evolving landscape.
The Key Components of Business Intelligence Systems
Business Intelligence (BI) systems are composed of several essential components that work together to transform raw data into meaningful insights. Understanding these components helps businesses optimize their data strategy and enhance decision-making processes.
Data Sources are the foundation of any BI system. They include internal sources like CRM systems, ERP software, and databases, as well as external sources such as market research and social media. The integration of diverse data sources ensures a comprehensive view of business operations.
Data Warehousing is where all the gathered data is stored. It acts as a central repository that consolidates data from multiple sources, making it easier to access and analyze. A well-structured data warehouse enhances data integrity and streamlines reporting processes.
Data Analysis Tools are crucial for extracting actionable insights from the collected data. These tools can include statistical analysis software, machine learning algorithms, and data mining applications. With advanced data analysis tools, businesses can uncover trends and patterns that inform strategic decisions.
Reporting and Visualization are vital components that help present data clearly and effectively. Dashboards and visual reports allow stakeholders to grasp complex data quickly. By using graphs, charts, and interactive visualizations, businesses can communicate insights in a way that’s engaging and easy to understand.
Performance Management tools help organizations track key performance indicators (KPIs) relevant to their goals. These tools facilitate continuous monitoring and evaluation of business performance, enabling timely adjustments to strategies. Setting up performance management with BI systems ensures alignment with organizational objectives.
User Interface plays a significant role in the success of BI systems. A user-friendly interface ensures that stakeholders can easily navigate and interact with data. Intuitive design principles and customization options enhance user engagement, making it easier for decision-makers to leverage insights effectively.
Security and Governance are critical in maintaining data integrity and confidentiality. Implementing adequate security measures and governance protocols ensures that sensitive information is protected while allowing authorized users to access necessary data. This balance is vital for fostering trust in BI systems.
| Component | Description |
|---|---|
| Data Sources | Internal and external origins of data. |
| Data Warehousing | Centralized storage for easy access and analysis. |
| Data Analysis Tools | Software for deriving insights from data. |
| Reporting & Visualization | Methods for presenting data clearly. |
| Performance Management | Tools for tracking KPIs and performance metrics. |
| User Interface | User-friendly design for effective interaction. |
| Security & Governance | Measures to protect data and ensure compliance. |
How Business Intelligence Works: A Simplified Explanation
Business Intelligence (BI) functions as a crucial framework that transforms raw data into actionable insights, enabling organizations to make informed decisions. At its core, BI involves a series of processes that collect, analyze, and present data in a way that is understandable and useful for business users.
Let’s break down how this intricate system operates:
- Data Collection: Businesses gather data from various sources, which can include transactional databases, customer relationship management (CRM) systems, and external market research. This data can be structured, like sales figures, or unstructured, such as customer feedback from social media.
- Data Warehousing: After collection, the data is stored in a data warehouse. This is a centralized repository that organizes and consolidates data from different sources. A well-designed data warehouse simplifies retrieval and analysis, making it easier for businesses to access insights.
- Data Processing: Once stored, the data undergoes processing. This includes cleaning, transforming, and aggregating the data to ensure accuracy. Tools like ETL (Extract, Transform, Load) are often used in this phase to prepare data for analysis.
- Data Analysis: Analysts use various BI tools to explore the processed data. They employ techniques such as data mining, statistical analysis, and predictive modeling to identify trends and patterns. This step is crucial for uncovering insights that can drive business strategies.
- Data Visualization: Presenting data in a visually appealing format is essential. BI tools often include dashboards and reports that use graphs, charts, and maps to provide a clear picture of the findings. This visualization helps stakeholders grasp complex data quickly and effectively.
- Decision-Making: The insights generated from data analysis empower decision-makers. By understanding trends and patterns, businesses can formulate strategies that enhance operations, improve customer experience, and drive profitability.
For example, a retail company may analyze sales data to identify which products are performing best during specific seasons. By visualizing this data on a dashboard, executives can make strategic decisions about inventory management and marketing campaigns to maximize sales.
Here’s a quick overview of the BI process in a tabular format:
| Step | Purpose |
|---|---|
| Data Collection | Gathering data from various sources |
| Data Warehousing | Centralized storage of data |
| Data Processing | Cleaning and preparing data for analysis |
| Data Analysis | Extracting insights from processed data |
| Data Visualization | Presenting insights in a user-friendly format |
| Decision-Making | Using insights to inform business strategies |
By simplifying complex data into actionable insights, BI equips businesses with the tools they need to adapt to market changes, understand customer behavior, and ultimately, achieve their objectives. Embracing business intelligence is not just an option—it’s a necessity for companies that aspire to thrive in a competitive landscape.
Real-World Examples of Business Intelligence in Action
Business intelligence (BI) isn’t just a buzzword; it’s a powerful tool that organizations leverage to make data-driven decisions. Let’s dive into some real-world examples that illustrate BI in action and how it transforms businesses across various sectors.
Retail: Major retailers like Walmart utilize business intelligence tools to analyze purchasing trends and customer behavior. By leveraging data from their point-of-sale systems and customer loyalty programs, Walmart can predict what products will be in demand and adjust inventory levels accordingly. This not only reduces waste but also ensures that customers find what they’re looking for, ultimately enhancing their shopping experience.
Healthcare: In the healthcare sector, organizations like Kaiser Permanente use BI to improve patient care and operational efficiency. By analyzing data from electronic health records, they can identify patterns in patient outcomes and resource utilization. For instance, BI tools help them manage hospital admissions and discharges more effectively, ensuring that resources are allocated where they’re needed the most. This leads to better care for patients and lower operational costs for the organization.
Finance: Financial institutions such as American Express harness BI to enhance customer engagement and risk management. By analyzing customer transaction data, they can identify spending patterns and offer personalized credit products tailored to individual needs. Additionally, BI aids in detecting fraudulent activities by spotting anomalies in transaction behaviors, which is crucial in protecting both the company and its customers.
| Industry | Application of BI | Benefits |
|---|---|---|
| Retail | Predictive analytics for inventory management | Reduced waste, improved customer satisfaction |
| Healthcare | Data analysis from electronic health records | Enhanced patient care, operational efficiency |
| Finance | Customer transaction behavior analysis | Personalized offerings, fraud detection |
Manufacturing: Companies like General Electric have embraced BI to streamline their production processes. By implementing IoT devices connected with BI software, GE can monitor machinery performance in real-time. This predictive maintenance approach helps in reducing downtime and maximizing productivity. The data collected enables them to improve manufacturing processes continuously while lowering costs significantly.
Hospitality: In the hospitality industry, chains like Marriott utilize BI to enhance customer experience and optimize operations. By analyzing guest data, they can personalize marketing campaigns and provide tailored services. BI tools help them determine peak booking times and manage staffing accordingly, ensuring that guest experiences are seamless. This not only increases customer satisfaction but also boosts revenue through optimized occupancy rates.
These examples highlight the versatility of business intelligence across various sectors. By harnessing the power of data, organizations can not only enhance their operational efficiency but also provide better products and services to their customers. As more businesses begin to recognize the importance of BI, the opportunities for innovation and improvement will only continue to grow.

Choosing the Right Business Intelligence Tools for Your Needs
When it comes to selecting business intelligence tools, the landscape is vast and varied. With numerous options available, finding the right fit for your organization can feel overwhelming. Here are some key factors to consider in your decision-making process:
- Define Your Objectives: Start by identifying what you want to achieve with your business intelligence tools. Are you looking to improve reporting, gain deeper insights, or enhance data visualization? Having clear goals will help you narrow down your choices.
- Assess Your Data Sources: Consider where your data is coming from. The right tool should be able to integrate seamlessly with your existing data sources, whether they are databases, spreadsheets, or cloud services.
- User Experience: The usability of a tool is crucial. Ensure that it is user-friendly, with an intuitive interface that allows your team to navigate easily without extensive training.
- Scalability: As your business grows, so will your data needs. Choose a tool that can scale with you, allowing you to add features and capabilities as your requirements evolve.
- Cost Considerations: Evaluate your budget and the total cost of ownership for each tool. Look beyond the initial purchase price to consider long-term costs such as subscriptions, training, and maintenance.
Another important aspect to consider is the level of support and community associated with the tool. A strong support system can make a significant difference in your experience, especially if you encounter challenges during implementation or usage. Look for tools that offer:
- Comprehensive documentation and tutorials
- Responsive customer support channels
- Active user communities or forums
It’s also beneficial to explore trial versions or demos of potential tools. These allow you to test the functionality and see how well they align with your needs before making a commitment. During the trial, pay attention to:
- How easy it is to generate reports and dashboards
- The quality of visualizations provided
- Integration capabilities with other tools you use
To give you a clearer perspective, here’s a simplified comparison table of some popular business intelligence tools:
| Tool | Best For | Key Features |
|---|---|---|
| Tableau | Data Visualization | Drag-and-drop interface, interactive dashboards |
| Power BI | Microsoft Integration | Seamless integration with MS products, cost-effective |
| Looker | Custom Data Models | Data modeling, embedded analytics |
| Qlik Sense | Associative Data Modeling | In-memory data processing, guided analytics |
Ultimately, the right business intelligence tool for your organization will depend on your unique needs, goals, and resources. Taking the time to thoroughly evaluate options will empower you to make an informed decision that supports your business’s success in the long run.

Integrating Business Intelligence into Your Business Strategy
Integrating business intelligence (BI) into your business strategy is not just a trend; it’s a necessity for organizations looking to thrive in today’s data-driven landscape. By leveraging BI tools, companies gain a competitive edge, uncovering insights that inform decision-making and drive growth.
Understanding Business Needs: Before diving into BI solutions, it’s crucial to identify your business goals. Consider the following aspects:
- What are your key performance indicators (KPIs)?
- Which areas require improvement?
- What are your customers saying about your products/services?
- How can data help enhance your operational efficiency?
Once you’ve established these criteria, you can tailor your BI initiatives to effectively address them. This alignment ensures that your BI strategies are not just about data collection but also about actionable insights that resonate with your company’s vision.
Choosing the Right BI Tools: The market offers a diverse array of BI tools, each with unique features and capabilities. Here are a few popular options:
- Tableau: Renowned for its intuitive data visualization capabilities.
- Power BI: Ideal for Microsoft users, offering seamless integration with Excel and other Microsoft products.
- Looker: A robust option for companies focusing on integrated data analytics.
When selecting a tool, consider factors like ease of use, scalability, and the ability to integrate with existing systems. A well-chosen BI tool can transform raw data into meaningful insights, guiding strategic initiatives.
Data Integration: Effective BI requires the ability to gather and analyze data from various sources. This might include:
- CRM systems
- Financial databases
- Social media platforms
- Website analytics
By integrating data from these sources, businesses can achieve a holistic view of their operations. This comprehensive perspective enables teams to identify trends, forecast future performance, and make informed decisions based on solid evidence.
Creating a Data-Driven Culture: For BI to be successful, it must be embraced by the entire organization. Here’s how to foster a culture that values data:
- Provide training on BI tools and data literacy.
- Encourage the use of data in everyday decision-making.
- Recognize and reward data-driven achievements.
When employees are empowered with the right tools and knowledge, they can leverage data to innovate and drive the company forward. Remember, data should be seen as a valuable asset rather than a hindrance to productivity.
Measuring Success: After implementing BI solutions, it’s crucial to measure their impact. This can be achieved through:
- Tracking KPI improvements
- Assessing user engagement with BI tools
- Evaluating business outcomes linked to data-driven decisions
By continuously monitoring these metrics, businesses can refine their BI strategies, ensuring they remain aligned with their overarching goals and objectives. Ultimately, the integration of business intelligence into your strategy is about transforming data into decisions that propel your organization toward success.

Common Challenges in Implementing Business Intelligence
Implementing business intelligence is a transformative journey for organizations, but it comes with its own set of hurdles. Understanding these challenges is crucial for a successful BI solution. One of the primary obstacles is data integration. Organizations often operate with disparate systems that house valuable data. Combining these datasets into a unified view requires robust ETL (Extract, Transform, Load) processes. If not managed correctly, this can lead to inconsistent analytics and decision-making.
Another significant challenge lies in user adoption. Even the most sophisticated BI tools are ineffective if employees are resistant to using them. This resistance can stem from a variety of factors, including lack of training, fear of new technology, or simply a perceived complexity of the system. To foster a culture of data-driven decision-making, companies must invest in comprehensive training programs and promote a positive attitude towards BI tools.
Moreover, data quality cannot be overlooked. Poor quality data can skew insights, leading to misguided business strategies. Organizations often struggle with maintaining clean data, resulting in errors that compromise the reliability of their BI outputs. Implementing data governance practices is essential to ensure that the data used for analysis is accurate, up-to-date, and relevant.
Another challenge is the cost of implementation. The initial investment in BI tools can be substantial, and organizations may find it difficult to justify these costs without immediate returns. It’s important for businesses to set clear expectations and timelines for ROI and to continuously evaluate and optimize their BI strategies to ensure they’re getting value for their investment.
the complexity of analytics can be daunting. With the abundance of data available, determining which metrics to track and how to interpret them can overwhelm teams. This often leads to analysis paralysis, stalling decision-making processes. Businesses must define key performance indicators (KPIs) clearly and provide actionable insights that align directly with their strategic goals.
| Challenge | Solution |
|---|---|
| Data Integration | Implement robust ETL processes |
| User Adoption | Invest in training programs |
| Data Quality | Establish data governance practices |
| Cost of Implementation | Set clear ROI expectations |
| Complexity of Analytics | Define clear KPIs |

Best Practices for Maximizing Your Business Intelligence Efforts
To truly harness the power of business intelligence, adopting a strategic approach is essential. Here are some key practices to help you optimize your BI initiatives and drive meaningful insights:
- Define Clear Objectives: Start with a well-defined purpose. Establish what you hope to achieve with your BI efforts—whether it’s increasing sales, improving customer satisfaction, or optimizing operations. Clear goals will guide your data collection and analysis.
- Invest in the Right Tools: Choose BI tools that align with your business needs and scale with your growth. Evaluate options based on user-friendliness, integration capabilities, and data visualization features to ensure your team can leverage these tools effectively.
- Focus on Data Quality: Accurate and reliable data is the backbone of effective business intelligence. Implement data governance practices to ensure data integrity, and regularly clean and update your datasets to avoid making decisions based on outdated or erroneous information.
In addition to the foundational steps, consider the following strategies to enhance your BI efforts:
- Encourage Cross-Department Collaboration: Foster a culture where different departments share insights and data. This collaboration can lead to a more holistic understanding of your business and uncover opportunities that may have otherwise gone unnoticed.
- Utilize Data Visualization: Transform complex data into easy-to-understand visual presentations. Use charts, graphs, and dashboards to communicate insights clearly, making it easier for stakeholders to grasp trends and take informed action.
- Regularly Review and Adapt: The business landscape is constantly evolving, so it’s vital to periodically review your BI strategies. Gather feedback from users, assess the effectiveness of your tools, and be willing to pivot your approach as needed.
Lastly, training and development play a crucial role in BI success:
| Training Focus | Details |
|---|---|
| Tool Proficiency | Ensure your team is well-versed in the BI tools you have adopted. |
| Data Literacy | Empower employees to understand and interpret data effectively. |
| Analytical Skills | Enhance critical thinking and analytical skills across your workforce. |
By implementing these best practices, you can significantly enhance your business intelligence efforts, ensuring that the data you gather translates into actionable insights that propel your business forward. Remember, the goal is not just to collect data but to transform it into a powerful decision-making asset.

The Role of Data Visualization in Business Intelligence
Data visualization plays a pivotal role in the realm of business intelligence, transforming raw data into meaningful insights that can drive strategic decisions. By presenting complex information in a visual format, businesses can swiftly identify trends, patterns, and anomalies that would otherwise remain obscured in dense spreadsheets or databases.
One of the primary benefits of data visualization is its ability to make data accessible to various stakeholders, regardless of their technical expertise. Here’s how effective visualization can enhance understanding:
- Clarity: Visual elements like charts and graphs simplify data interpretation.
- Engagement: Interactive dashboards capture attention and encourage exploration of the data.
- Speed: Quick visual insights lead to faster decision-making.
Moreover, data visualization facilitates storytelling with data. When stakeholders can see a visual progression of business performance over time, they can appreciate the implications of decisions more readily and communicate findings effectively to their teams. This storytelling aspect is crucial in fostering a data-driven culture within the organization.
To illustrate the impact of visualization, consider the following table that compares various types of visualizations and their appropriate use cases:
| Visualization Type | Best Used For |
|---|---|
| Bar Chart | Comparing quantities across categories |
| Line Graph | Showing trends over time |
| Pie Chart | Displaying proportions of a whole |
| Heat Map | Visualizing data density or correlation |
Incorporating data visualization tools into business intelligence solutions can further enhance their effectiveness. Tools like Tableau, Power BI, and Google Data Studio empower users to create dynamic visual representations, allowing them to engage with the data interactively. This interactivity not only aids in exploration but also in deriving actionable insights on the fly.
it’s essential to remember that the best data visualizations are not only aesthetically pleasing but also tailored to the audience’s needs. By focusing on what information is most relevant to the viewer, organizations can ensure that their visualizations drive home critical insights and foster informed decision-making.
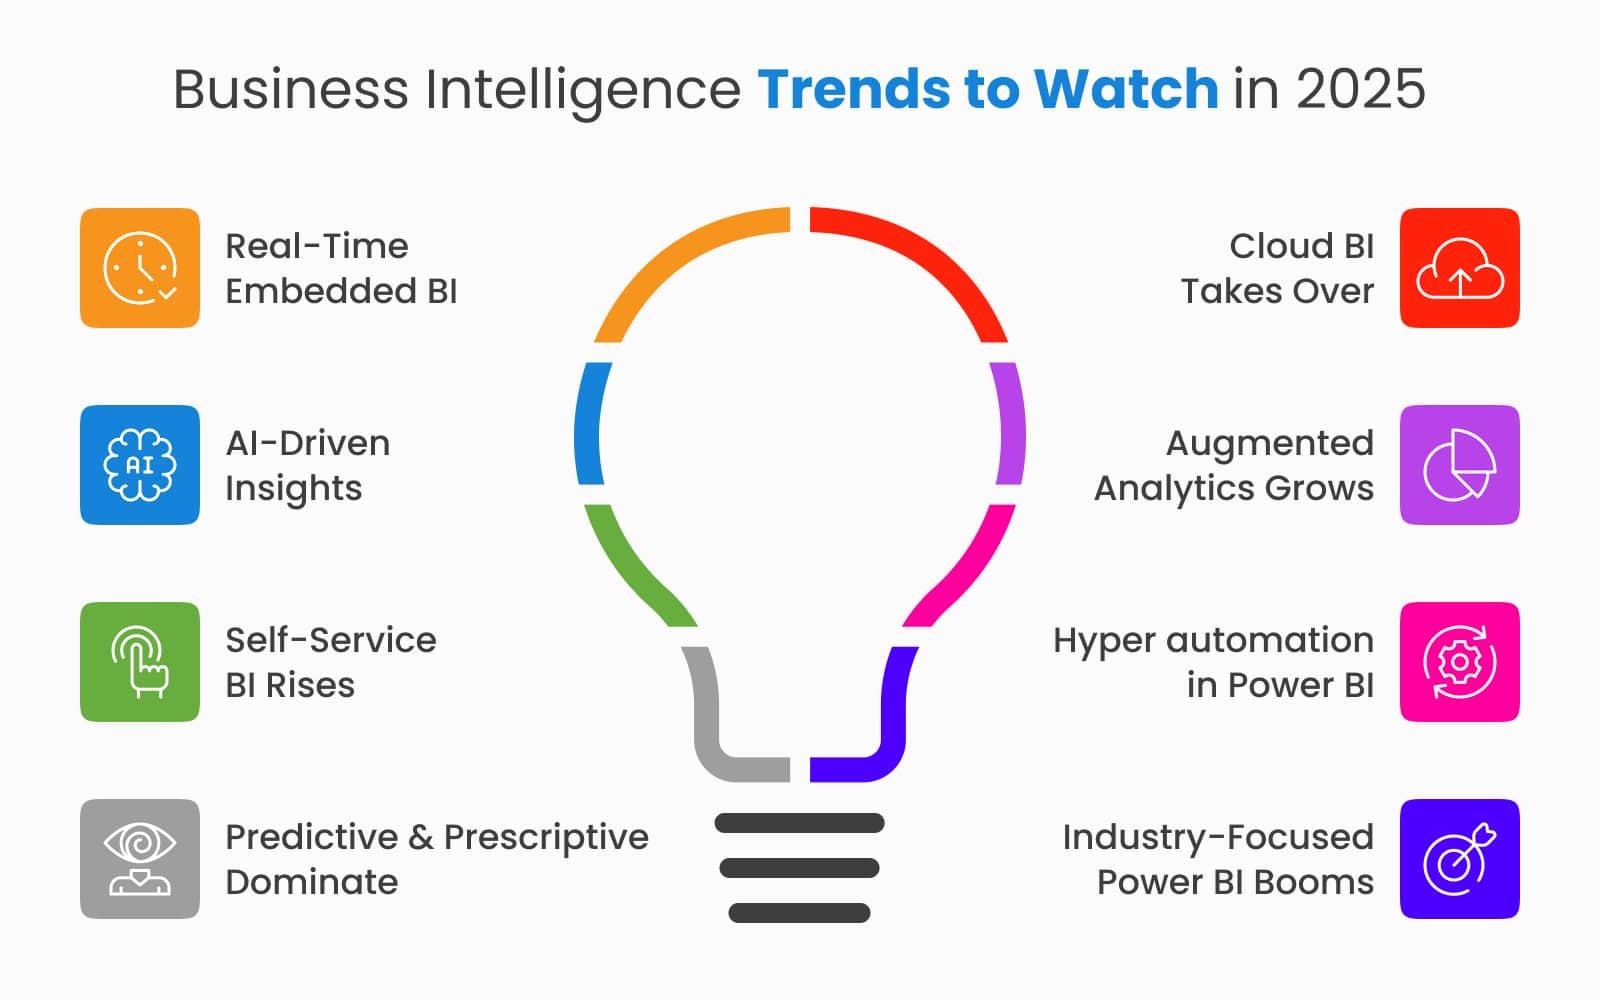
Future Trends in Business Intelligence to Watch
As we look ahead, the landscape of Business Intelligence (BI) is evolving rapidly, driven by technological advancements and changing business needs. Keeping an eye on emerging trends can help organizations stay competitive and make informed decisions. Here are some trends that are reshaping the future of BI.
1. AI and Machine Learning Integration: The integration of artificial intelligence (AI) and machine learning into BI tools is transforming how businesses analyze data. These technologies can automate data analysis, uncover hidden patterns, and provide predictive insights that help organizations make proactive decisions.
2. Self-Service BI: More organizations are empowering their teams with self-service BI tools. This trend allows non-technical users to access and analyze data independently, enhancing data literacy across the organization. Self-service BI tools are designed to be user-friendly, enabling employees to create reports and dashboards without the need for IT intervention.
3. Real-Time Data Analytics: The demand for real-time insights is growing. Businesses are shifting towards solutions that provide real-time data analytics, enabling them to respond swiftly to market changes and customer needs. This capability is essential for staying agile in a fast-paced business environment.
4. Cloud-Based BI Solutions: The shift to cloud computing is significantly impacting BI. Cloud-based BI solutions offer scalability, flexibility, and cost-effectiveness, making them accessible for businesses of all sizes. With cloud BI, organizations can easily share insights and collaborate across teams, regardless of their physical locations.
5. Data Governance and Security: As data becomes more integral to decision-making, ensuring data privacy and security is paramount. Companies are increasingly focusing on data governance frameworks to maintain data integrity, compliance, and security. This trend emphasizes the need for robust policies and protocols to protect sensitive information while enabling data-driven decision-making.
6. Natural Language Processing (NLP): The incorporation of NLP into BI tools is making data interaction more intuitive. Users can now query data using natural language, making insights more accessible to those without technical expertise. This trend significantly lowers the barrier to entry for data analysis.
7. Augmented Analytics: Augmented analytics combines AI and machine learning with BI processes, simplifying data preparation and insight generation. This trend accelerates the data analysis process, allowing users to focus on interpreting results rather than getting bogged down by data wrangling.
| Trend | Description | Impact |
|---|---|---|
| AI and Machine Learning | Automates data analysis and provides predictive insights. | Improves decision-making speed and accuracy. |
| Self-Service BI | Empowers users to analyze data independently. | Increases data literacy and reduces reliance on IT. |
| Real-Time Analytics | Provides insights on the fly for agile decision-making. | Enhances responsiveness to market changes. |
| Cloud-Based Solutions | Offers scalable and cost-effective BI tools. | Facilitates collaboration and accessibility. |
Staying ahead in the realm of Business Intelligence requires an understanding of these trends. By embracing these advancements, organizations can cultivate a data-driven culture that not only enhances operational efficiency but also fosters innovation and strategic growth.
How to Measure the Success of Your Business Intelligence Initiatives
Measuring the success of your business intelligence initiatives is essential for ensuring that your efforts translate into tangible outcomes. It goes beyond simply tracking data; it requires a strategic approach to evaluation and continuous improvement. Here are some key metrics and methods to assess the effectiveness of your BI initiatives:
- Return on Investment (ROI): This is the cornerstone metric for assessing any initiative. Calculate the ROI by comparing the benefits gained from the BI tools against the costs incurred in implementing them. A positive ROI indicates that your BI efforts are worth the investment.
- User Adoption Rates: The success of BI tools hinges on their adoption by users. Track how many employees are actively using the BI tools and how frequently they are utilized. High adoption rates suggest that the tools are meeting user needs.
- Data Accuracy and Consistency: Evaluate the quality of the data being used in your BI processes. High-quality data leads to better insights and decision-making. Implement checks to ensure that data remains accurate and consistent across various platforms.
- Time to Insight: Measure how quickly your team can derive insights from the data. The faster the insights are generated, the more agile your business becomes. Look for ways to reduce bottlenecks in the data analysis process.
- Employee Satisfaction and Feedback: Engage with employees to gather feedback on the BI tools. Satisfaction surveys can provide insights into user experience and highlight areas for improvement. Happy users are often more productive and engaged.
Another effective technique is to utilize Key Performance Indicators (KPIs) that align with your business goals. These KPIs should be specific, measurable, achievable, relevant, and time-bound (SMART). For example, if your goal is to increase sales, you might track metrics such as:
| Sales Metric | Target | Current Performance |
|---|---|---|
| Total Revenue | $1,000,000 | $850,000 |
| New Customers Acquired | 500 | 400 |
| Customer Retention Rate | 90% | 85% |
Lastly, consider establishing a regular review process for your BI initiatives. Schedule periodic assessments to evaluate progress against your goals and make necessary adjustments. Continuous feedback and adaptation are crucial to maintaining the relevance and effectiveness of your business intelligence strategies.
measuring the success of your business intelligence initiatives is a multifaceted endeavor. By focusing on metrics like ROI, user adoption, data quality, and relevant KPIs, you can gain deeper insights into the impact of your BI efforts and drive your organization toward greater success.

Building a Business Intelligence Culture in Your Organization
Creating a robust business intelligence culture within your organization is essential for leveraging data to make informed decisions. It goes beyond just using tools and software; it’s about fostering an environment where data-driven thinking is the norm. Here’s how to cultivate this culture:
- Encourage Data Literacy: Start by providing training and resources that enhance data literacy across all levels. This could include workshops, online courses, or even regular lunch-and-learns focused on interpreting data.
- Foster Collaboration: Promote cross-departmental projects that require data sharing and analysis. When teams collaborate, they not only share insights but also learn from each other, enriching the overall organizational knowledge.
- Lead by Example: Leadership should consistently utilize data in their decision-making processes. When employees see management relying on data, they are more likely to adopt a similar approach.
- Promote a Curious Mindset: Encourage employees to ask questions and seek insights from data. A curious workforce is more likely to identify trends and opportunities that data can reveal.
Implementing the right tools is vital, but tools alone won’t create a data-driven culture. You need to integrate these tools into daily workflows. Consider adopting the following strategies:
- Make Data Accessible: Ensure that everyone has easy access to relevant data, whether it’s through dashboards, reports, or data visualization tools. The more accessible data is, the more likely employees will use it.
- Establish Clear KPIs: Define clear key performance indicators (KPIs) that align with your organizational goals. This allows teams to focus their data efforts on what’s truly important and measure success effectively.
- Celebrate Data Successes: Recognize and reward teams or individuals who successfully leverage data in their projects. Celebrations can reinforce the value of data-driven decision-making.
continuous improvement is key. Regularly assess your business intelligence initiatives to identify areas for enhancement. Gather feedback from employees to understand their experiences with data tools and processes. This will help in adapting and evolving your strategies to meet the needs of your organization.
By embedding these principles into your organizational culture, you will not only unlock the full potential of your data but also empower your teams to make smarter, faster decisions that drive business success.
Tips for Training Your Team on Business Intelligence Tools
Training your team on business intelligence (BI) tools is essential for maximizing their potential. A well-informed team can unlock insights that drive business decisions and foster a data-driven culture within your organization. Here are some actionable tips to ensure your training is effective and engaging.
- Start with the Basics: Before diving into complex functionalities, ensure that everyone understands fundamental concepts of BI. Familiarize them with key terminology and the overall purpose of these tools.
- Use Real-Life Examples: Utilize case studies and examples from your industry to illustrate how BI tools can solve specific problems. This makes the training relatable and shows the practical applications of what they’re learning.
- Hands-On Training: Encourage active participation through hands-on exercises. Allow team members to navigate the BI tools and conduct their own analyses. This experiential learning solidifies their understanding.
- Encourage Collaboration: Foster a collaborative environment where team members can share insights and learn from one another. Consider group projects that require the use of BI tools, promoting teamwork and collective problem-solving.
Incorporating a structured training plan can also significantly enhance learning outcomes. Consider breaking the training program into distinct phases:
| Phase | Focus Area | Duration |
|---|---|---|
| Phase 1 | Introduction to BI Concepts | 1 Week |
| Phase 2 | Exploring BI Tools | 2 Weeks |
| Phase 3 | Hands-On Projects | 3 Weeks |
| Phase 4 | Feedback and Improvement | Ongoing |
Another effective strategy is to utilize various training materials. Consider the following resources:
- Video Tutorials: Create or share video content that visually demonstrates how to use specific features of the BI tools.
- User Manuals: Provide comprehensive guides that team members can refer to as needed.
- Interactive Webinars: Host live sessions where team members can ask questions and interact with experts in real-time.
Lastly, implement a feedback loop where team members can voice their concerns and suggest improvements for future training sessions. Regularly updating your training content based on feedback ensures that your team stays engaged and informed about the latest functionalities and best practices.

Leveraging Business Intelligence for Competitive Advantage
In today’s fast-paced business landscape, leveraging data effectively can mean the difference between thriving and merely surviving. Organizations that harness the power of business intelligence (BI) can outpace competitors by making more informed decisions based on real-time data analysis. By integrating BI tools into their operations, companies can uncover valuable insights that drive strategic initiatives and optimize processes.
One of the most significant advantages of utilizing BI is the ability to enhance decision-making. With access to comprehensive data and analytics, businesses can:
- Identify trends in consumer behavior, allowing for more targeted marketing efforts.
- Monitor performance metrics to pinpoint areas needing improvement or investment.
- Forecast future outcomes based on historical data, reducing risks associated with business decisions.
Moreover, BI allows for greater operational efficiency. Companies can streamline their workflows by:
- Automating reporting, which saves time and reduces human error.
- Integrating data sources to have a unified view of business operations.
- Tracking key performance indicators (KPIs) in real-time to ensure that goals are met.
Consider the retail sector, where businesses leverage BI to refine inventory management. By analyzing sales patterns and customer preferences, retailers can:
- Optimize stock levels to reduce excess inventory costs.
- Enhance customer experience through personalized marketing campaigns.
- Align product offerings with market demand, ensuring higher sales conversions.
Additionally, BI tools can foster a culture of data-driven decision-making across departments. When employees have access to relevant data, they are empowered to:
- Collaborate effectively by sharing insights across teams.
- Innovate by identifying new market opportunities through analysis.
- Enhance customer relationships by leveraging insights to tailor services.
To illustrate the impact, let’s look at a simplified comparison of two hypothetical retail companies:
| Company | Monthly Revenue | Customer Retention Rate |
|---|---|---|
| Company A (Without BI) | $100,000 | 50% |
| Company B (With BI) | $150,000 | 75% |
This example highlights how effective implementation of business intelligence can lead to significant improvements in both revenue and customer retention. Company B, utilizing BI tools, not only increased its monthly revenue but also established a more loyal customer base.
the integration of business intelligence into business strategies is not just a trend; it is a necessity for staying competitive. By embracing BI, organizations can transform raw data into actionable insights, fostering innovation, improving efficiency, and ultimately driving growth. The competitive edge gained through BI is a powerful catalyst for success in today’s data-driven world.
Frequently Asked Questions (FAQ)
Q&A: What Is Business Intelligence? (A Complete Guide With Examples)
Q1: What exactly is Business Intelligence (BI)?
A1: Great question! Business Intelligence, or BI, refers to the technology, applications, and practices used to collect, analyze, and present business data. Think of it as your company’s crystal ball—it helps you make informed decisions by turning raw data into actionable insights. Imagine being able to see trends, forecast future performance, and make data-driven decisions that keep your business ahead of the competition. Sounds powerful, right?
Q2: How does BI benefit businesses?
A2: The benefits of BI are immense! It enhances decision-making by providing real-time data insights, which means you can act quickly and efficiently. It can improve operational efficiency by identifying bottlenecks or areas for improvement. Plus, it helps in understanding customer behavior and preferences, allowing for more targeted marketing strategies. Imagine being able to tailor your offerings perfectly to what your customers want—now that’s a game-changer!
Q3: Can you give me some real-world examples of BI in action?
A3: Absolutely! Let’s take a look at online retailers like Amazon. They use BI to analyze customer purchase history and browsing behavior, enabling them to recommend products that you may love based on your past purchases. Another example is Starbucks, which uses BI to analyze customer data and optimize their store locations and inventory management. By understanding where their customers are and what they want, they can make better decisions that drive sales. Isn’t it fascinating how these companies leverage BI to stay ahead?
Q4: What tools are commonly used in Business Intelligence?
A4: There are several fantastic BI tools available today! Popular options include Tableau, Power BI, and QlikView. These tools allow you to visualize data, create dashboards, and generate reports that make sense of complex information. They’re user-friendly, so even if you’re not a data expert, you can easily glean insights from your data. Choosing the right tool can make a world of difference in how effectively you can use BI!
Q5: Is BI only for large corporations?
A5: Not at all! While large corporations often have the resources to implement complex BI systems, small and medium-sized enterprises (SMEs) can also benefit significantly from BI. Many BI tools are scalable and affordable, making them accessible for businesses of all sizes. In fact, leveraging BI can be a critical differentiator for smaller companies looking to compete with bigger firms. So, whether you’re a startup or a well-established business, BI can help you make smarter decisions!
Q6: How can I get started with Business Intelligence?
A6: Getting started with BI is easier than you might think! Begin by identifying the key metrics that matter most to your business. Next, choose a BI tool that aligns with your needs and budget. Start small—maybe with a single dashboard—and gradually expand as you become more comfortable. There are plenty of online resources and courses available to help you learn the ropes. Remember, the sooner you start leveraging BI, the sooner you can unlock the potential hidden within your data!
Q7: Why should I invest in Business Intelligence?
A7: Investing in BI is investing in your business’s future. It empowers you to make confident, data-driven decisions that can lead to increased revenue, improved customer satisfaction, and streamlined operations. In today’s fast-paced market, relying on gut feelings isn’t enough; you need solid data to back up your strategies. Think of BI as your business’s secret weapon—one that can give you a significant edge over your competitors!
Remember, the world of Business Intelligence is vast and constantly evolving. As you explore this guide, keep in mind that the insights you gain can shape the future of your business. So why wait? Dive in and start transforming your data into a strategic asset today!
Insights and Conclusions
As we wrap up our exploration of business intelligence, it’s clear that harnessing the power of data is more than just a trend; it’s a necessity in today’s fast-paced business world. By enabling organizations to glean actionable insights, improve decision-making, and drive strategic initiatives, business intelligence transforms the way companies operate and compete.
Whether you’re a seasoned professional or just dipping your toes into the world of data analytics, embracing business intelligence can unlock new opportunities for growth and innovation. Remember, it’s not just about collecting data; it’s about turning that data into a compelling story that guides your business forward.
So why wait? Start integrating business intelligence tools into your strategy today and see how they can elevate your operations to new heights. If you have any questions or want to share your experiences, feel free to drop a comment below. Let’s keep the conversation going—after all, the best insights often come from sharing knowledge with each other!