So, you’re ready to take the plunge and launch your very own startup! Exciting times, right? But before you dive headfirst into the world of entrepreneurship, there’s one crucial step you can’t overlook: creating an eye-catching and effective website. In today’s digital age, your website is often the first impression potential customers will have of your business. It’s not just a placeholder; it’s your online storefront, your brand ambassador, and your 24/7 salesperson—all rolled into one.
But don’t worry! Building a website for your startup doesn’t have to be a daunting task. In fact, with the right approach, it can be a fun and rewarding experience. In this ultimate 7-step guide, we’ll walk you through everything you need to know to create a website that not only showcases your unique offerings but also connects with your audience and drives conversions. Whether you’re a tech whiz or a complete novice, we’ll break it down into manageable steps so you can focus on what really matters: turning your vision into reality. Let’s get started on crafting a stunning website that sets your startup on the path to success!
Understanding the Importance of a Great Startup Website
In today’s digital landscape, your startup’s website serves as the crucial touchpoint between you and your potential customers. A well-crafted website not only showcases your brand but also establishes credibility, communicates your value proposition, and drives conversions. Here are some key reasons why a great startup website is indispensable:
First Impressions Matter: Your website is often the first interaction a client has with your brand. A professional and appealing design can capture attention and build trust from the get-go.
Showcase Your Brand Identity: A thoughtfully designed website reflects your brand’s personality and mission, helping to differentiate you from competitors and making a lasting impact on visitors.
Enhance User Experience: An intuitive layout, fast loading times, and clear navigation can significantly improve the user experience, encouraging visitors to stay longer and engage with your content.
Boost Visibility: A website optimized for search engines increases your chances of being discovered by potential customers searching for solutions you offer.
Generate Leads: By providing clear calls-to-action (CTAs) and strategically placed contact forms, your website can effectively capture leads and convert visitors into customers.
Moreover, a great website allows you to tell your startup’s story effectively. You can share your journey, the challenges you’ve overcome, and the unique solutions you provide. This narrative not only resonates with visitors but also fosters emotional connections, which are paramount in today’s market.
Another critical feature of a successful startup website is its ability to adapt to different devices. With the increasing use of smartphones and tablets, you must ensure that your site is fully responsive. A website that looks good and functions seamlessly on any device not only improves user experience but also positively impacts your search engine rankings.
As you develop your startup website, consider how analytics tools can provide invaluable insights into your audience’s behavior. By tracking metrics such as page views, bounce rates, and user demographics, you can refine your content and marketing strategies to better serve your audience’s needs.
Website Feature
Importance
Responsive Design
Ensures accessibility on all devices
SEO Optimization
Increases visibility on search engines
Clear CTAs
Encourages user engagement and lead generation
Fast Loading Times
Reduces bounce rates and improves user satisfaction
Ultimately, your startup website is a vital asset that can propel your business forward. By investing time and resources into creating a great site, you’re not just building a digital presence; you’re laying the foundation for future growth and success. Embrace the potential of your website to captivate audiences, foster relationships, and drive your venture towards its goals.
Identifying Your Target Audience for Maximum Impact
Understanding who your audience is can be the difference between a website that flops and one that thrives. When you’re building your startup website, it’s crucial to pinpoint exactly who you’re trying to reach. The more specific you are about your target audience, the easier it becomes to tailor your content, design, and marketing strategies to meet their needs.
Start by creating buyer personas. These are fictional representations of your ideal customers, based on market research and real data about your existing customers. To create effective personas, consider the following factors:
Demographics: Age, gender, location, education, and income level.
Psychographics: Interests, values, lifestyle choices, and pain points.
Behavioral Patterns: Purchasing habits, brand loyalty, and online behavior.
Next, utilize tools like Google Analytics and social media insights to gather data on your current visitors and followers. This information can unveil trends and preferences that help refine your understanding of who your target audience is. Pay attention to metrics such as:
Another strategy is to conduct surveys or interviews with potential customers. Ask open-ended questions that allow them to express their needs, challenges, and what they look for in a product or service like yours. This direct feedback can provide invaluable insights into their decision-making processes.
It’s also beneficial to analyze your competitors. Who are they targeting? What messages resonate with their audience? By studying their approach, you can identify gaps in the market or areas where you can differentiate your offerings.
Once you’ve gathered enough information, create a content strategy that speaks directly to your audience’s needs and desires. Use their language, address their pain points, and highlight how your product or service provides a solution.
continuously test and refine your approach. Use A/B testing for your website content and marketing campaigns to see what resonates best with your audience. Stay flexible and adapt your strategies based on performance data and feedback. This ongoing process will ensure your startup website remains relevant and impactful, effectively connecting you to your target audience.
Choosing the Right Domain Name That Stands Out
Choosing the perfect domain name is crucial for your startup’s online presence. It’s often the first impression potential customers will have of your brand, making it essential that it resonates well and sticks in their minds. Here are some key factors to consider when selecting a domain name that truly stands out:
Keep It Short and Simple: A shorter name is easier to remember and less likely to be misspelled. Aim for under 15 characters where possible.
Consider Keywords: Including relevant keywords can help with SEO. Think about what your target audience is searching for.
Make It Brandable: Your domain should reflect your brand’s personality. Avoid complicated words or phrases that might confuse your potential customers.
Avoid Numbers and Hyphens: These can create confusion. If someone hears your domain name, they might not know whether to use a numeral or spell it out.
Choose the Right Extension: While .com is still the most popular, there are other options like .co, .io, or niche-specific extensions that might suit your brand better.
Once you’ve brainstormed some domain name ideas, make sure to check their availability. Use domain registrars to see what’s out there, and make sure to act quickly if you find something you love, as good names can get snatched up fast. If your ideal name isn’t available, consider slight variations or creative twists that maintain the essence of your brand.
It’s also wise to think about the future. Choose a domain name that can grow with your business. If you plan to expand your offerings or target different markets, avoid names that are too specific to one product or service.
To help visualize the process of choosing a domain name, here’s a simple table that outlines the pros and cons of different types of domain names:
Domain Type
Pros
Cons
.com
Most recognized, trusted, and memorable.
High competition for names.
.co
Short, and gaining popularity.
May still be confused with .com.
.info
Descriptive and informative.
Often viewed as less professional.
Niche Extensions (e.g., .tech)
Specific, can improve SEO.
Less recognized, may confuse users.
test your domain name with friends and potential users. Getting feedback can provide invaluable insights on whether your chosen name hits the mark or needs some refining. Remember, a strong domain name not only represents your brand but also sets the tone for your entire online identity.
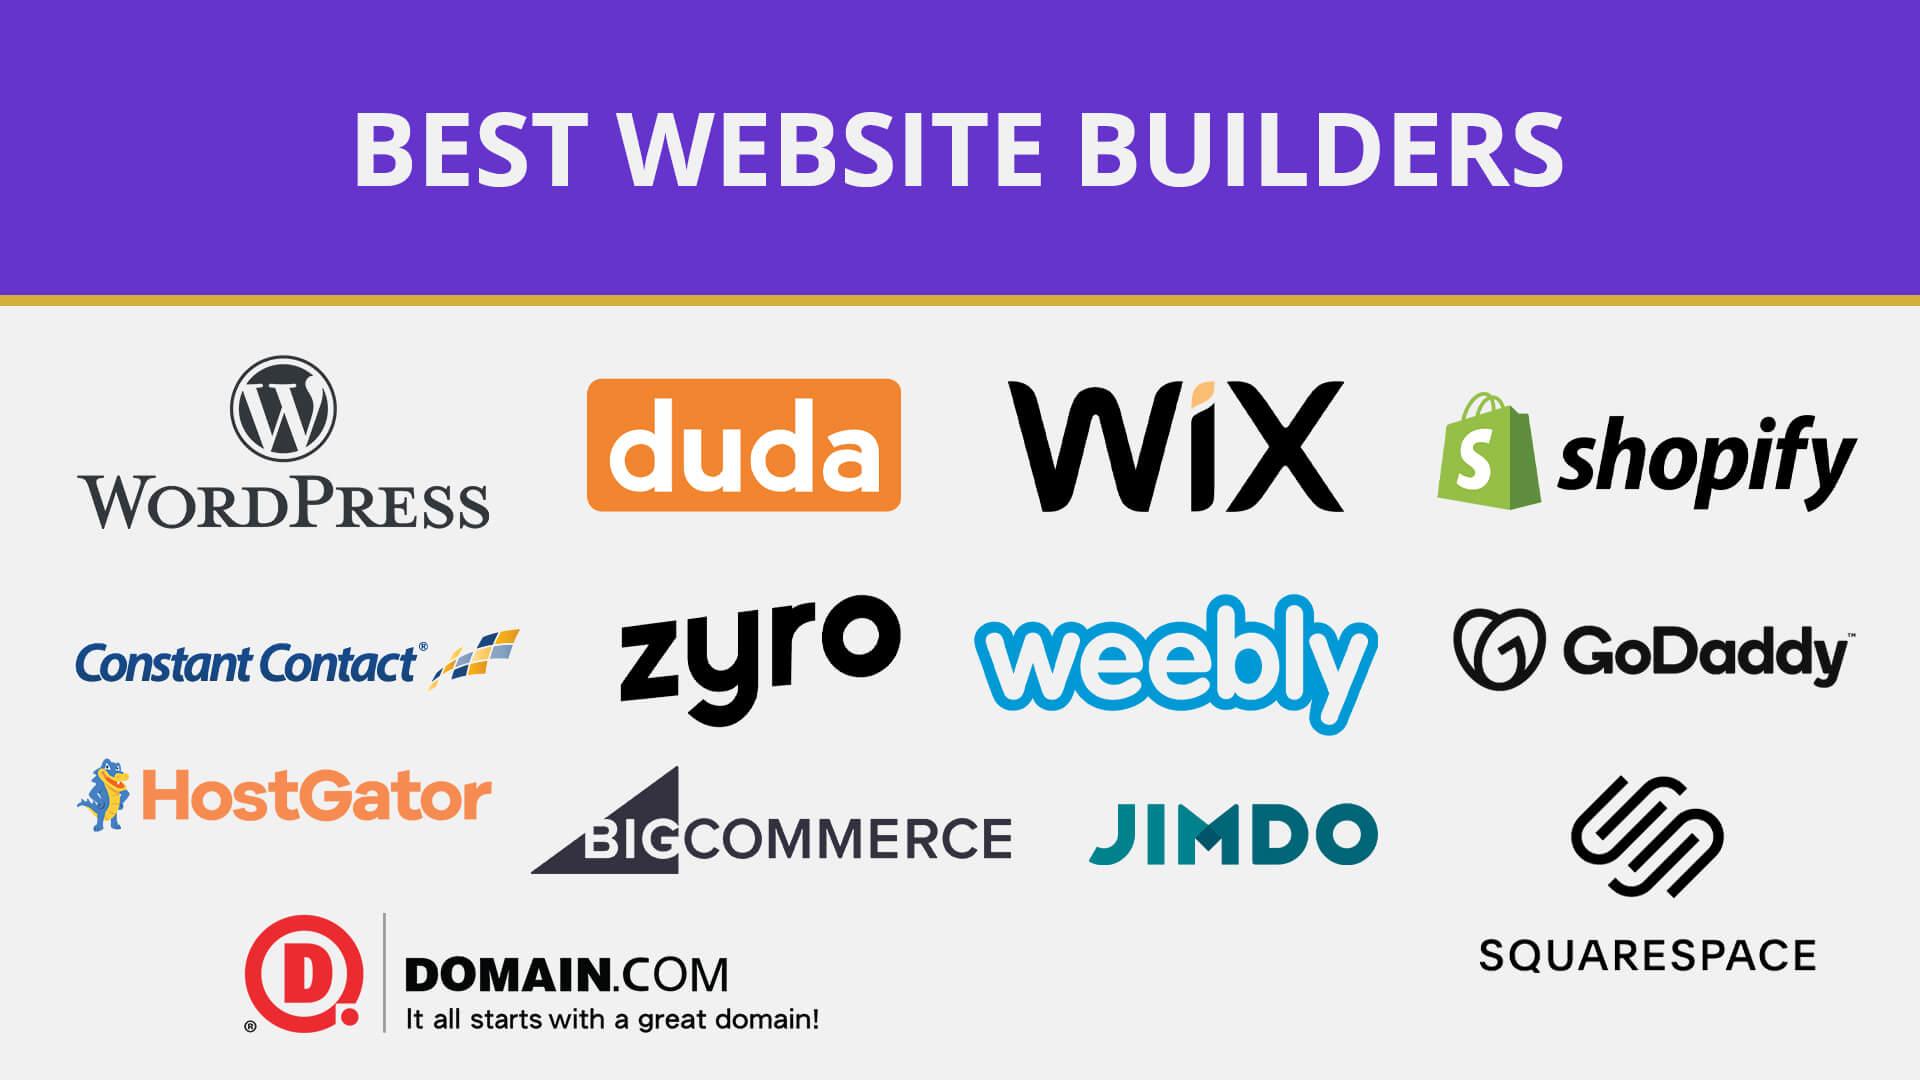
Selecting a Website Builder That Fits Your Needs
Choosing the right website builder is crucial for your startup’s online presence. With a variety of options available, each offering unique features, it’s essential to identify what aligns best with your goals. Here are some key factors to consider:
Ease of Use: Look for a builder with a user-friendly interface. A drag-and-drop feature can simplify the design process, especially if you’re not technically inclined.
Customization Options: Ensure that the platform allows for enough flexibility to create a site that reflects your brand’s identity. Custom templates and the ability to add your own code can be beneficial.
Responsive Design: Your website should look great on all devices. Check if the builder provides mobile-responsive templates or allows for easy adjustments.
SEO Capabilities: A good website builder should include built-in SEO tools to help improve your site’s visibility on search engines.
Support and Resources: Consider the availability of customer support, tutorials, and community forums. A strong support system can help you overcome challenges quickly.
Another important aspect to evaluate is the pricing structure of the website builders. Many platforms offer free trials, which can be an excellent way to test them out without commitment. However, keep an eye on:
Remember that some platforms may charge extra fees for additional features, such as a custom domain or premium templates. Always read the fine print and ensure you understand what’s included in each pricing tier.
Lastly, think about the long-term implications of your choice. Will the builder scale as your business grows? Investing in a more versatile platform from the start may save you the hassle of migrating your site later. Assess your future needs and select a builder that can evolve with your startup.
Designing an Engaging User Experience That Captivates Visitors
Creating a captivating user experience is vital for any startup website. A well-designed interface not only attracts visitors but also keeps them engaged, encouraging them to explore further and take action. Here are some essential components to consider:
Simplicity is Key: Ensure your website is easy to navigate. A clean, uncluttered design helps users find what they’re looking for without frustration.
Responsive Design: With the rise of mobile browsing, a responsive design that looks great on all devices is crucial. This adaptability enhances user experience and boosts SEO rankings.
Visual Hierarchy: Use size, color, and placement to guide users through your content. Highlight important elements like call-to-action buttons to draw attention.
Fast Load Times: Optimize images and scripts to ensure your website loads swiftly. Users are likely to abandon sites that take too long to load.
Furthermore, engaging content is a must. Your website should tell a story that resonates with your audience. Consider incorporating the following:
High-Quality Visuals: Use eye-catching images, videos, and infographics to break up text and maintain interest.
Interactive Elements: Features like quizzes, polls, or calculators can make the experience more immersive.
Consistent Branding: Make sure your branding is cohesive across all pages. This builds trust and recognition with your audience.
Additionally, understanding your audience is fundamental. Conduct user research to gather insights about their preferences and behaviors. This information can guide design decisions, ensuring the site meets user expectations. Here’s a simple table to illustrate key demographics:
Age Group
Preferred Content Type
Average Time Spent
18-24
Videos & Social Media
5-10 minutes
25-34
Blogs & Articles
10-15 minutes
35-44
Webinars & Case Studies
15-20 minutes
never underestimate the power of feedback. Incorporate tools like surveys or feedback forms to gather user opinions. This not only helps you identify areas for improvement but also makes your visitors feel valued and heard. By fostering a two-way communication channel, you enhance loyalty and trust.
to design an engaging user experience, focus on simplicity, responsiveness, and understanding your audience’s needs. Combine these elements with captivating content and a consistent brand voice, and you’ll create a startup website that truly captivates visitors.
Crafting Compelling Content That Tells Your Story
In today’s digital landscape, the ability to engage your audience through storytelling is paramount. When crafting content for your startup website, the goal is to create a narrative that resonates with your visitors. This narrative should not only explain what your business does but also convey your passion, mission, and values. After all, people connect with stories, not just services or products.
To achieve this, consider the following elements:
Your Brand’s Origin: Share the inspiration behind your startup. What problem sparked your journey? This personal touch can create a deeper connection with your audience.
Customer-Centric Focus: Highlight how your product or service addresses the needs of your target market. Use testimonials or case studies to illustrate real-world impact.
Visual Storytelling: Incorporate engaging visuals—images, infographics, or videos—that complement your narrative. A captivating visual can often convey a message more effectively than text alone.
Another crucial aspect is to maintain a consistent brand voice throughout your content. Whether your tone is playful and casual or professional and authoritative, consistency builds trust and recognition. Create style guidelines to ensure every piece of content reflects your brand’s personality.
Don’t forget to optimize your content for search engines while keeping it relatable. Use relevant keywords naturally to enhance visibility without compromising the storytelling aspect. This balance will ensure that your story reaches the right audience, allowing your startup to flourish.
To illustrate the effectiveness of storytelling in content, consider the following table that outlines key elements of successful storytelling:
Element
Description
Relatability
Your audience should see themselves in your story.
Conflict
Introduce challenges that your startup has overcome.
Resolution
Clearly articulate how your startup provides solutions.
Lastly, invite your audience to be part of your journey. Encourage them to engage with your content through comments, shares, or social media. This not only builds community but also strengthens the connection between you and your audience, turning visitors into loyal supporters.
Optimizing for SEO to Boost Your Online Visibility
When creating a startup website, one of the most crucial aspects to consider is how to optimize it for search engines. Strong SEO practices not only enhance your visibility but also attract the right audience to your site, ultimately leading to higher conversions. Here are some essential strategies to implement:
Keyword Research: Start by identifying relevant keywords that your target audience is searching for. Utilize tools like Google Keyword Planner or SEMrush to find keywords with good search volume and low competition.
On-Page SEO: Ensure that your chosen keywords are included in key areas such as the title, headings, meta descriptions, and throughout your content. This helps search engines understand the context of your pages.
Quality Content: Focus on creating high-quality, informative, and engaging content that meets the needs of your audience. The more valuable your content is, the more likely it is to be shared and linked to by others.
Mobile Optimization: With a significant amount of traffic coming from mobile devices, ensure your website is mobile-friendly. Responsive design improves user experience and boosts SEO rankings.
Page Load Speed: A slow-loading website can lead to high bounce rates. Optimize images, use caching, and minimize code to ensure your pages load quickly.
Another important aspect is link building. Building both internal and external links can enhance your site’s authority in the eyes of search engines. Here’s how to approach it:
Link Type
Description
Benefits
Internal Links
Links that point to other pages within your own website.
Links from your website to other credible sites.
Enhances credibility and provides valuable resources to users.
Backlinks
Links from other websites pointing back to yours.
Boosts your site’s authority and improves search rankings.
don’t underestimate the power of analytics. Utilize tools like Google Analytics and Google Search Console to monitor your website’s performance. Pay attention to metrics such as:
Traffic Sources: Understand where your visitors are coming from.
Behavior Flow: Analyze how users navigate through your site.
Conversion Rates: Measure how well your site converts visitors into customers.
By continuously reviewing your performance and adapting your strategy based on the data, you can ensure that your SEO efforts yield positive results, ultimately leading to sustained growth for your startup. Remember, SEO is not a one-time task, but an ongoing process that requires regular updates and adjustments to keep ahead of the competition.
Integrating Essential Features That Enhance Functionality
To create a successful startup website, integrating essential features is crucial for enhancing functionality and user experience. Each feature should not only serve a purpose but also align with your overall business goals. Here are some key functionalities to consider:
Responsive Design: Ensure your website is fully responsive. With a large percentage of users browsing on mobile devices, a mobile-friendly design boosts accessibility and user satisfaction.
Fast Loading Speeds: Implement techniques to minimize loading times. This can include optimizing images, using caching, and a content delivery network (CDN) to improve speed and performance.
In addition to these features, consider the following elements that can significantly enhance your website:
Effective Call-to-Actions (CTAs): Strategically placed CTAs guide users towards desired actions, be it signing up for a newsletter, making a purchase, or requesting a demo. Use contrasting colors and compelling text to make them stand out.
Integrated Analytics: Set up tools like Google Analytics to track user behavior. This data can inform decisions about content, design, and marketing strategies, ensuring continuous improvement.
SEO Optimization: Incorporate SEO best practices to increase visibility in search engines. Use keyword-rich content, meta tags, and alt text for images to enhance your organic reach.
Security cannot be overlooked as well. Implement SSL certificates to encrypt user data and build trust. In addition, consider using plugins that provide security scans and malware protection. Here’s a quick overview:
Feature
Benefit
SSL Certificate
Enhances trust and protects user data
Security Plugins
Regular scans to identify vulnerabilities
don’t forget about social media integration. Add social sharing buttons to your content, allowing visitors to share your offerings easily. This not only promotes your brand but also expands your reach.
By carefully integrating these essential features, you can create a startup website that not only looks good but also functions effectively, paving the way for growth and success.
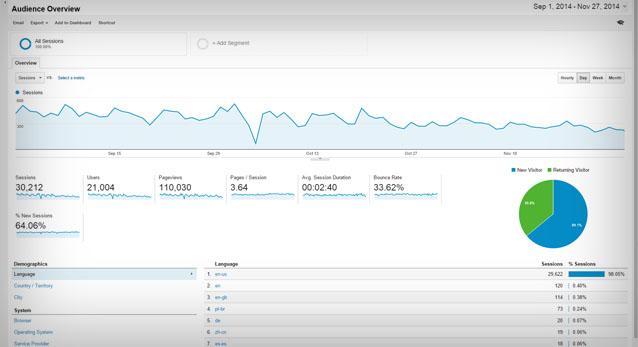
Setting Up Analytics to Track Your Websites Performance
Tracking your website’s performance is essential for understanding your audience and optimizing your content. Setting up analytics can seem daunting at first, but with the right tools and approach, it can be a straightforward process. Here’s how to get started:
Choose the Right Analytics Tool
The first step is selecting an analytics tool that fits your needs. Google Analytics is the most popular choice due to its robust features and free access. However, there are other options available that might suit specific requirements:
Google Analytics – Comprehensive features and free for most users.
Matomo – Great for those concerned with data privacy.
Fathom – Focuses on simplicity and speed without compromising on data.
Plausible - Lightweight and privacy-friendly analytics.
Install the Tracking Code
Once you’ve chosen your analytics tool, the next step is to install the tracking code on your website. This code allows the tool to collect data about your visitors. Here’s how to do it:
Log in to your analytics account and generate the tracking code.
Copy the code snippet provided.
Paste the code into your website’s section, just before the closing tag.
If you’re using a CMS like WordPress, you can use plugins to make this step easier.
Setting Up Goals and Conversions
To truly understand your website’s performance, you need to set up goals that reflect your business objectives. Goals can include:
By tracking these conversions, you can measure the effectiveness of your marketing campaigns and website changes.
Monitor Key Metrics
Familiarize yourself with critical metrics that will help you analyze your website’s performance:
Metric
Description
Traffic Sources
Where your visitors are coming from (e.g., organic search, social media, direct traffic).
Bounce Rate
The percentage of visitors who leave after viewing only one page.
Average Session Duration
The average time a visitor spends on your site.
Pages per Session
The average number of pages viewed during a visit.
Regularly Analyze Data
Setting up analytics is just the beginning. To improve your website’s performance continuously, you should regularly analyze the data collected. Look for trends, spikes in traffic, and areas requiring improvement. Consider these practices:
Review your analytics dashboard weekly.
Identify which pages perform best and which need optimization.
Use A/B testing to determine which changes yield the best results.
Integrate with Other Tools
Enhance your analytics capabilities by integrating with other tools. For example, combining Google Analytics with Google Search Console can provide insights into your website’s SEO performance. Additionally, using heatmaps from tools like Hotjar can help you visualize user behavior on your site.
Launching Your Website and Making a Splash
After all the hard work you’ve put into creating your startup website, it’s time for the big reveal! Launching your website is an exciting milestone, and you want to ensure it makes a memorable impression. The moment your site goes live is just the beginning of your digital journey. Here’s how to create some serious buzz and ensure your launch resonates with your target audience.
First things first, build anticipation. Start by creating a pre-launch marketing strategy that includes:
Teaser content on social media
Email newsletters to your followers
A countdown timer on your landing page
These tactics not only engage potential visitors but also help you build a community around your brand before your official launch.
Once the big day arrives, don’t just flip the switch and walk away. Make a splash! Organize a launch event, whether it’s virtual or in-person, to celebrate this significant milestone. Here are a few ideas to consider:
Host a live Q&A session to engage with your audience
Offer promotional discounts or free trials for early adopters
Collaborate with influencers to amplify your reach
Beyond launch day, it’s crucial to keep the momentum going. Regularly update your content and engage with your audience. This will not only improve your SEO rankings but also keep visitors coming back for more. Consider creating a content calendar that includes:
Weekly blog posts
Monthly newsletters
Quarterly webinars
To help you track your progress and analyze how your website is performing post-launch, set up key performance indicators (KPIs). Here’s a simple table to monitor your metrics:
Metric
Target
Current
Website Traffic
500 visits/month
300 visits
Newsletter Sign-Ups
100 sign-ups
50 sign-ups
Social Media Followers
1,000 followers
700 followers
don’t forget to celebrate your wins, no matter how small! Each milestone is a step towards your larger goals. Share your achievements with your audience to build trust and authenticity. It also inspires them to join you on your journey.
Promoting Your Website Through Effective Marketing Strategies
Once your startup website is live, the next crucial step is to attract visitors. Utilizing effective marketing strategies can significantly enhance your online presence and drive traffic to your site. Here are some innovative approaches to consider:
Search Engine Optimization (SEO): Optimize your website for search engines to improve visibility. Focus on keywords related to your niche and create high-quality content that answers the questions your target audience is asking.
Social Media Marketing: Leverage platforms like Facebook, Instagram, and LinkedIn to share valuable content and engage with potential customers. Tailor your message to fit the platform and audience.
Email Marketing: Build a mailing list and send regular newsletters to keep your audience updated. Personalize your emails to improve engagement and conversion rates.
Content Marketing: Create blogs, videos, and infographics that provide value to your audience. Not only does this establish your authority, but it also encourages sharing and inbound links.
Paid Advertising: Consider Google Ads or social media ads for immediate visibility. Target specific demographics to ensure that your ads reach the right people.
To track the effectiveness of these strategies, it’s crucial to analyze your website’s performance. Consider the following metrics:
Metric
Description
Traffic Sources
Understand where your visitors are coming from (organic, social, direct).
Bounce Rate
Measure the percentage of visitors who leave after viewing only one page.
Conversion Rate
Track how many visitors take a desired action (sign-up, purchase).
Engagement Rate
Monitor likes, shares, and comments on your content.
Don’t forget the power of networking. Collaborate with other businesses and influencers in your industry to expand your reach. Joint ventures or guest blogging can introduce your website to a broader audience. Additionally, participating in online forums and communities can position you as a knowledgeable resource in your field.
Lastly, always be open to feedback. Engage with your audience through surveys or social media polls to understand their needs better. This not only helps you refine your marketing strategies but also builds a loyal community around your brand. Remember, the key to successful website promotion is consistency and adaptability—be ready to tweak your strategies as you learn what works best for you!
Gathering Feedback and Iterating for Continuous Improvement
Building a successful startup website isn’t just about launching it; it’s about continually evolving it to meet the needs of your audience. Gathering feedback is a crucial step in this process. It allows you to understand what works, what doesn’t, and what can be improved. By actively seeking input from your users, you can make informed decisions that enhance their experience.
Here are some effective strategies to gather feedback:
Surveys and Polls: Utilize tools like Google Forms or Typeform to create simple surveys that can be embedded directly on your site. Ask specific questions about usability, design, and content.
User Testing: Invite users to navigate your website while you observe their interactions. This helps identify friction points and areas for improvement.
Feedback Widgets: Integrate feedback widgets on your pages, allowing users to leave comments or ratings effortlessly.
Social Media Engagement: Use your social media channels to solicit feedback. Ask open-ended questions and encourage discussions.
Once you’ve gathered feedback, it’s essential to analyze the data thoughtfully. Look for trends and common themes in user responses. Are there recurring issues that multiple users mention? Prioritize these areas as they are likely to have the most significant impact on user satisfaction. Conducting a SWOT analysis (Strengths, Weaknesses, Opportunities, Threats) can also help you visualize where to focus your improvement efforts.
After identifying the areas needing attention, it’s time to iterate. This doesn’t mean making drastic changes all at once. Instead, adopt an agile approach, making small, incremental improvements. This method allows you to test changes and measure their impact before rolling them out site-wide.
To help you organize your feedback and track your progress, consider using a simple table structure like the one below:
Feedback Category
Action Taken
Impact
Navigation Issues
Simplified menu structure
Increased user retention by 20%
Content Clarity
Revised copy for clarity
Boosted average time on page by 15%
Loading Speed
Optimized images and scripts
Reduced load time by 40%
Don’t forget to keep the conversation going. After implementing changes, reach out to your audience again to let them know you’ve listened. This builds trust and encourages ongoing engagement, making your users feel valued and more likely to return.
the key to a successful startup website is a commitment to continuous improvement. By regularly gathering feedback and iterating based on user insights, you not only enhance the user experience but also foster a loyal community that will support your growth.
Maintaining and Updating Your Website for Long-Term Success
To ensure your startup’s website remains relevant and effective, it’s crucial to adopt a proactive approach to maintenance and updates. This not only enhances user experience but also boosts your SEO rankings. Here are some essential practices to consider:
Regular Content Updates: Fresh content keeps your audience engaged. Make it a habit to publish blog posts, articles, or updates about your services and industry trends.
Monitor Website Performance: Use tools like Google Analytics to track visitor behavior. Understanding what works and what doesn’t can help you make informed adjustments.
Update Plugins and Themes: Keeping your WordPress plugins and themes up-to-date is vital for security and functionality. Schedule regular checks to ensure everything is current.
Back Up Your Website: Regular backups can save you from losing valuable data. Invest in a reliable backup solution to protect your website.
Enhance Website Speed: A slow-loading website can deter potential customers. Optimize images, leverage caching, and consider using a Content Delivery Network (CDN) to enhance speed.
Perform Security Checks: Cybersecurity threats are ever-evolving. Regularly scan your site for vulnerabilities and consider implementing security plugins.
As your business evolves, so should your website. This might mean redesigning certain aspects or updating your site’s functionality to align with new business goals or customer needs. Here’s a simple table to help you keep track of important updates:
Update Type
Frequency
Last Completed
Next Due
Content Refresh
Monthly
April 2023
May 2023
Plugin Updates
Weekly
April 15, 2023
April 22, 2023
Security Check
Bi-Weekly
April 10, 2023
April 24, 2023
By establishing a routine for these updates, you can not only streamline your maintenance efforts but also position your startup for long-term success. Remember, a well-maintained website is a powerful tool in your marketing arsenal that can draw in new customers and retain existing ones.
don’t underestimate the value of user feedback. Encourage your visitors to share their experiences and suggestions. This can provide valuable insights into what improvements can be made to enhance their interaction with your site. Implementing these strategies ensures your website is not just a one-time project but a dynamic resource that grows with your business.
Celebrating Your Launch and Planning for the Future
Congratulations on successfully launching your startup website! This is a momentous achievement that deserves to be celebrated. It’s a culmination of hard work, creativity, and countless hours of dedication. Now that you’ve made your mark online, it’s time to shift your focus towards the future. How do you maintain that momentum and ensure your website continues to evolve alongside your business?
First, consider the feedback you’ve received. Engaging with your audience can provide invaluable insights into what works and what doesn’t. Here are some effective ways to gather feedback:
Surveys: Use tools like Google Forms or SurveyMonkey to create quick surveys for your visitors.
Analytics: Dive into your website analytics to see where users are spending their time.
Social Media: Leverage your social media platforms to ask for direct input.
Next, prioritize continuous improvement. The digital landscape is constantly changing, and so should your website. Here are some strategies to keep your site fresh and relevant:
Regular Content Updates: Keep your blog updated with fresh content that resonates with your audience.
Design Refreshes: Consider a seasonal redesign or minor tweaks to keep the visual appeal alive.
Feature Additions: Introduce new features based on user needs, like a live chat option or enhanced product filters.
As you plan for the future, it’s crucial to set measurable goals. Think about what you want to achieve in the next year and how your website can help facilitate that. Here are a few suggestions:
Goal
Website Feature
Expected Outcome
Increase Traffic
SEO Optimization
Higher page rankings and more visitors
Boost Engagement
Interactive Content
More time spent on site
Generate Leads
Email Signup Forms
Growing subscriber base
Don’t forget the importance of networking and collaboration. Building relationships within your industry can lead to partnerships that enhance your website’s reach and credibility. Consider:
Guest Blogging: Invite experts to contribute to your blog, or write guest posts for others.
Joint Ventures: Team up with complementary businesses to cross-promote.
Community Engagement: Participate in local events to raise awareness about your brand.
keep your eyes on the trends. Technology and consumer preferences shift quickly, so staying informed will help you adapt your website effectively. Subscribe to industry newsletters, follow thought leaders on social media, and participate in webinars to keep your knowledge current.
Frequently Asked Questions (FAQ)
Q&A: How to Create a Startup Website (7-Step Ultimate Guide)
Q1: Why is having a website so important for my startup? A1: Great question! In today’s digital age, a website is often the first impression potential customers will have of your startup. It’s your online storefront, showcasing your brand, products, and services 24/7. A well-designed website not only enhances credibility but also helps you connect with your audience, drive traffic, and convert visitors into customers. Plus, it’s a platform to share your story and build a community around your brand!
Q2: What are the first steps I should take to create my startup website? A2: First things first—define your goals. What do you want your website to achieve? Is it to generate leads, sell products, or simply provide information? Once you have clarity on your objectives, move on to choosing a domain name that reflects your brand. Keep it simple, memorable, and relevant. After that, it’s all about selecting the right website builder or platform that suits your needs, whether it’s WordPress, Wix, or Shopify.
Q3: How can I make sure my website is user-friendly? A3: User experience is key! Start by ensuring your website has a clean layout and intuitive navigation. Use clear call-to-action buttons to guide visitors on what to do next—like signing up for a newsletter or making a purchase. Don’t forget about mobile optimization! A responsive design ensures your site looks great on any device. And remember, the faster your site, the better the experience—nobody likes a slow-loading page!
Q4: What content should I include on my startup website? A4: Content is king! You’ll want to include an engaging homepage that captures your brand’s essence, an ‘About Us’ page that shares your story, and a product or services page detailing what you offer. Additionally, a blog can be a fantastic way to provide valuable insights while boosting your SEO. Don’t forget to incorporate high-quality images and videos—visually appealing content can significantly enhance user engagement!
Q5: How do I ensure my website is optimized for search engines? A5: Ah, the magic of SEO! Start by researching keywords relevant to your startup and integrate them naturally into your content. Use descriptive titles and meta tags, and don’t overlook alt text for images. Creating a blog with regular, high-quality posts can also improve your visibility. Lastly, make sure your website’s loading speed is optimized and that it’s mobile-friendly—both are essential for SEO success!
Q6: What’s the best way to drive traffic to my new website? A6: Driving traffic is all about getting the word out! Utilize social media platforms to share your website and engage with your audience. Consider using email marketing to reach out to potential customers and keep them updated on your offerings. Collaborating with influencers or running pay-per-click ads can also be effective strategies. And don’t forget about networking—word of mouth can be a powerful tool for startups!
Q7: How do I track my website’s performance? A7: Monitoring your website’s performance is crucial for growth! Tools like Google Analytics can give you valuable insights into visitor demographics, behavior, and traffic sources. Look for key metrics like bounce rate, average session duration, and conversion rates. Regularly reviewing this data will help you understand what’s working and where you can improve, allowing you to refine your strategy for better results.
Q8: Any final tips for someone creating a startup website? A8: Absolutely! Stay authentic and let your brand personality shine through. Don’t rush the process—take your time to create a website that truly represents your startup. And remember, your website is a living entity; keep it updated with fresh content and new features. Listening to user feedback and adjusting accordingly can help you create a site that not only attracts visitors but keeps them coming back! Happy building!
Insights and Conclusions
Conclusion: Your Startup Website Awaits!
And there you have it—the 7-step ultimate guide to creating a stunning startup website! By following these steps, you’re not just building a website; you’re laying the foundation for your brand and creating a powerful platform to connect with your audience. Remember, your website is often the first impression potential customers will have of your business, so make it count!
Don’t hesitate to get creative and let your personality shine through. Whether you’re a tech guru, a passionate artist, or a savvy entrepreneur, your website should reflect who you are and what you stand for. And if you ever feel overwhelmed, just take it one step at a time. Rome wasn’t built in a day, and neither will your perfect website be!
So, roll up your sleeves, dive in, and start building that online presence you’ve always dreamed of. The world is waiting to see what you have to offer. Let’s get started on this exciting journey—your startup website is just a few clicks away! Happy building!