How to Create an Interactive Map for a Website (4 Easy Methods)
In today’s digital world, engaging your website visitors is more important than ever. One of the most effective ways to do this? An interactive map! Whether you’re showcasing a travel destination, highlighting your business locations, or sharing geographical data, an interactive map can transform a flat page into a dynamic experience that draws users in. But you might be wondering, “How do I even get started?” Don’t worry; you don’t need to be a tech wizard to create a stunning interactive map for your website. In this article, we’ll walk you through four easy methods that anyone can tackle. So, grab a cup of coffee, and let’s dive into the world of interactive mapping—your visitors will thank you!
Understanding the Need for Interactive Maps on Your Website
In the digital landscape, user engagement is crucial for a successful website, and one effective way to enhance that engagement is through interactive maps. These dynamic tools not only make information more accessible but also transform the way visitors interact with your content. By incorporating an interactive map, you can provide users with a richer experience that encourages them to explore your website more deeply.
One significant advantage of using interactive maps is their ability to present complex data in a visually appealing format. Instead of bombarding users with endless lists of information, a map allows you to showcase locations, statistics, or other data points in a way that’s easy to understand. For example, a travel website can use a map to highlight various destinations, allowing users to click on each location for more details about attractions, accommodations, and local tips.
Moreover, interactive maps facilitate better user navigation. By allowing visitors to zoom in and out or filter information based on their preferences, you empower them to tailor their experience. This level of customization keeps users on your site longer, ultimately improving your bounce rate and enhancing overall site performance.
Another important reason to consider interactive maps is their ability to drive conversions. For businesses, an interactive map can be a powerful tool for showcasing service areas or store locations. When users can see exactly where your business operates, they are more likely to engage, whether that means visiting a physical location or making a purchase online. Here’s a quick look at how interactive maps can boost conversions:
| Benefit | Impact on Conversions |
|---|---|
| Visual Appeal | Attracts users’ attention, increasing engagement. |
| Interactive Features | Encourages users to explore more content. |
| Location Awareness | Helps users locate services easily, boosting foot traffic. |
| Data Presentation | Makes complex information digestible, leading to informed decisions. |
Lastly, let’s not overlook the SEO advantages of integrating interactive maps. They can enhance your website’s visibility by keeping users engaged longer, generating more page views, and decreasing bounce rates—all signals that search engines take into account when ranking websites. Additionally, if your map includes relevant keywords and metadata, it can be indexed by search engines, further boosting your site’s discoverability.
Incorporating interactive maps is not merely a trend; it’s a strategic move that addresses the modern user’s need for engaging, informative, and easily digestible content. By providing this interactive element, you can enhance user experience, drive conversions, and improve your site’s overall performance in an increasingly competitive online environment.
Choosing the Right Type of Interactive Map for Your Audience
When it comes to crafting an interactive map, understanding your audience is key. Different map types serve various purposes, and selecting the appropriate one can enhance user engagement and satisfaction. Start by considering the demographics, interests, and needs of your audience. This will guide you in choosing a map type that resonates with them.
Here are some popular types of interactive maps to consider:
- Geographical Maps: Ideal for audiences interested in location-based content, these maps can display geographical features, landmarks, or travel destinations.
- Data Visualization Maps: Best suited for analytical users, these maps can represent statistical data (like population density or environmental changes) in a visually engaging way.
- Story Maps: Perfect for storytelling, these interactive maps combine narrative with geographic information, making them great for educational or experiential content.
- Custom Maps: Tailored for niche audiences, custom maps can showcase specific data relevant to your users, such as local businesses or community resources.
Consider the following factors when selecting your map type:
| Factor | Considerations |
|---|---|
| Purpose | What do you want your audience to learn or experience? |
| Interactivity Level | How much interaction do you want your users to have? Simple clicks or complex data manipulation? |
| User Experience | Is the map easy to navigate? Does it provide a seamless experience across devices? |
| Content Type | What kind of content will be displayed on the map? Text, images, or multimedia? |
Additionally, consider the technical aspects of your interactive map. For instance, some map types may require more advanced coding skills or specialized software. If your audience appreciates a high level of detail and customization, investing in a map with robust features may be worthwhile. Conversely, if simplicity and ease of use are priorities, opt for a more straightforward solution.
Lastly, don’t forget about feedback! After launching your interactive map, encourage your audience to provide insights and suggestions. This can help you refine the map over time, ensuring it genuinely meets their needs. Remember, a successful interactive map isn’t just about aesthetics; it’s about creating a meaningful experience for your users.
Exploring Google Maps API for Seamless Integration
When it comes to embedding an interactive map into your website, the Google Maps API is an incredibly powerful tool that allows for seamless integration. Its extensive features not only enhance user experience but also provide essential functionalities for various applications, such as e-commerce, travel, and event management.
To get started with the Google Maps API, you’ll first need to obtain an API key. This key will grant you access to the various services and functionalities that Google Maps offers. Simply visit the Google Cloud Console, create a new project, and enable the Maps JavaScript API. Once you’ve done this, you will receive your unique API key, which you will use in all your API calls.
One of the standout features of the Google Maps API is its customizable markers. You can easily add specific markers to your map to highlight locations relevant to your business or project. Instead of the standard pin, you can upload your own images or icons, making your map not just functional but also visually appealing. Here’s how to do it:
- Define your locations – Create an array of locations with latitude and longitude.
- Create a Marker – Use the `new google.maps.Marker()` method to place custom markers on your map.
- Add an InfoWindow – Enhance user interaction by adding details about each location that pops up when a user clicks on the marker.
Another impressive aspect is the ability to integrate directions services. This feature allows you to provide users with turn-by-turn navigation from their current location to a selected destination. To implement this, you’ll utilize the Google Maps Directions API. Users will find it immensely helpful when trying to reach your physical store or an event location. Here’s a brief overview of how to set it up:
| Steps | Description |
|---|---|
| 1. Initialize Directions Service | Use `new google.maps.DirectionsService()`. |
| 2. Set up Directions Renderer | Visualize the route on the map with `new google.maps.DirectionsRenderer()`. |
| 3. Define Routes | Use the `route()` method to calculate the route based on start and end points. |
Don’t forget about the Geolocation feature, which allows users to find their current location on the map. This is particularly beneficial for mobile users. With just a few lines of code, you can enable users to see their location and explore nearby points of interest. Implementing geolocation can be as simple as:
- Accessing User Location – Use the `navigator.geolocation.getCurrentPosition()` method.
- Displaying Location – Create a marker for the user’s location.
- Updating Map View - Center the map on the user’s current position.
Lastly, the Google Maps API enables layering, allowing you to overlay additional information, like traffic conditions, bike lanes, and public transport routes. This not only enriches the user experience but makes your map a comprehensive tool for navigation and exploration.
By leveraging the versatility and extensive capabilities of the Google Maps API, you can create an interactive map that not only looks great but also serves as a functional asset to your website. Whether you’re showcasing multiple locations or providing directions, this API brings your web presence to life in an engaging and user-friendly manner.
Using Leaflet for Customizable Mapping Solutions
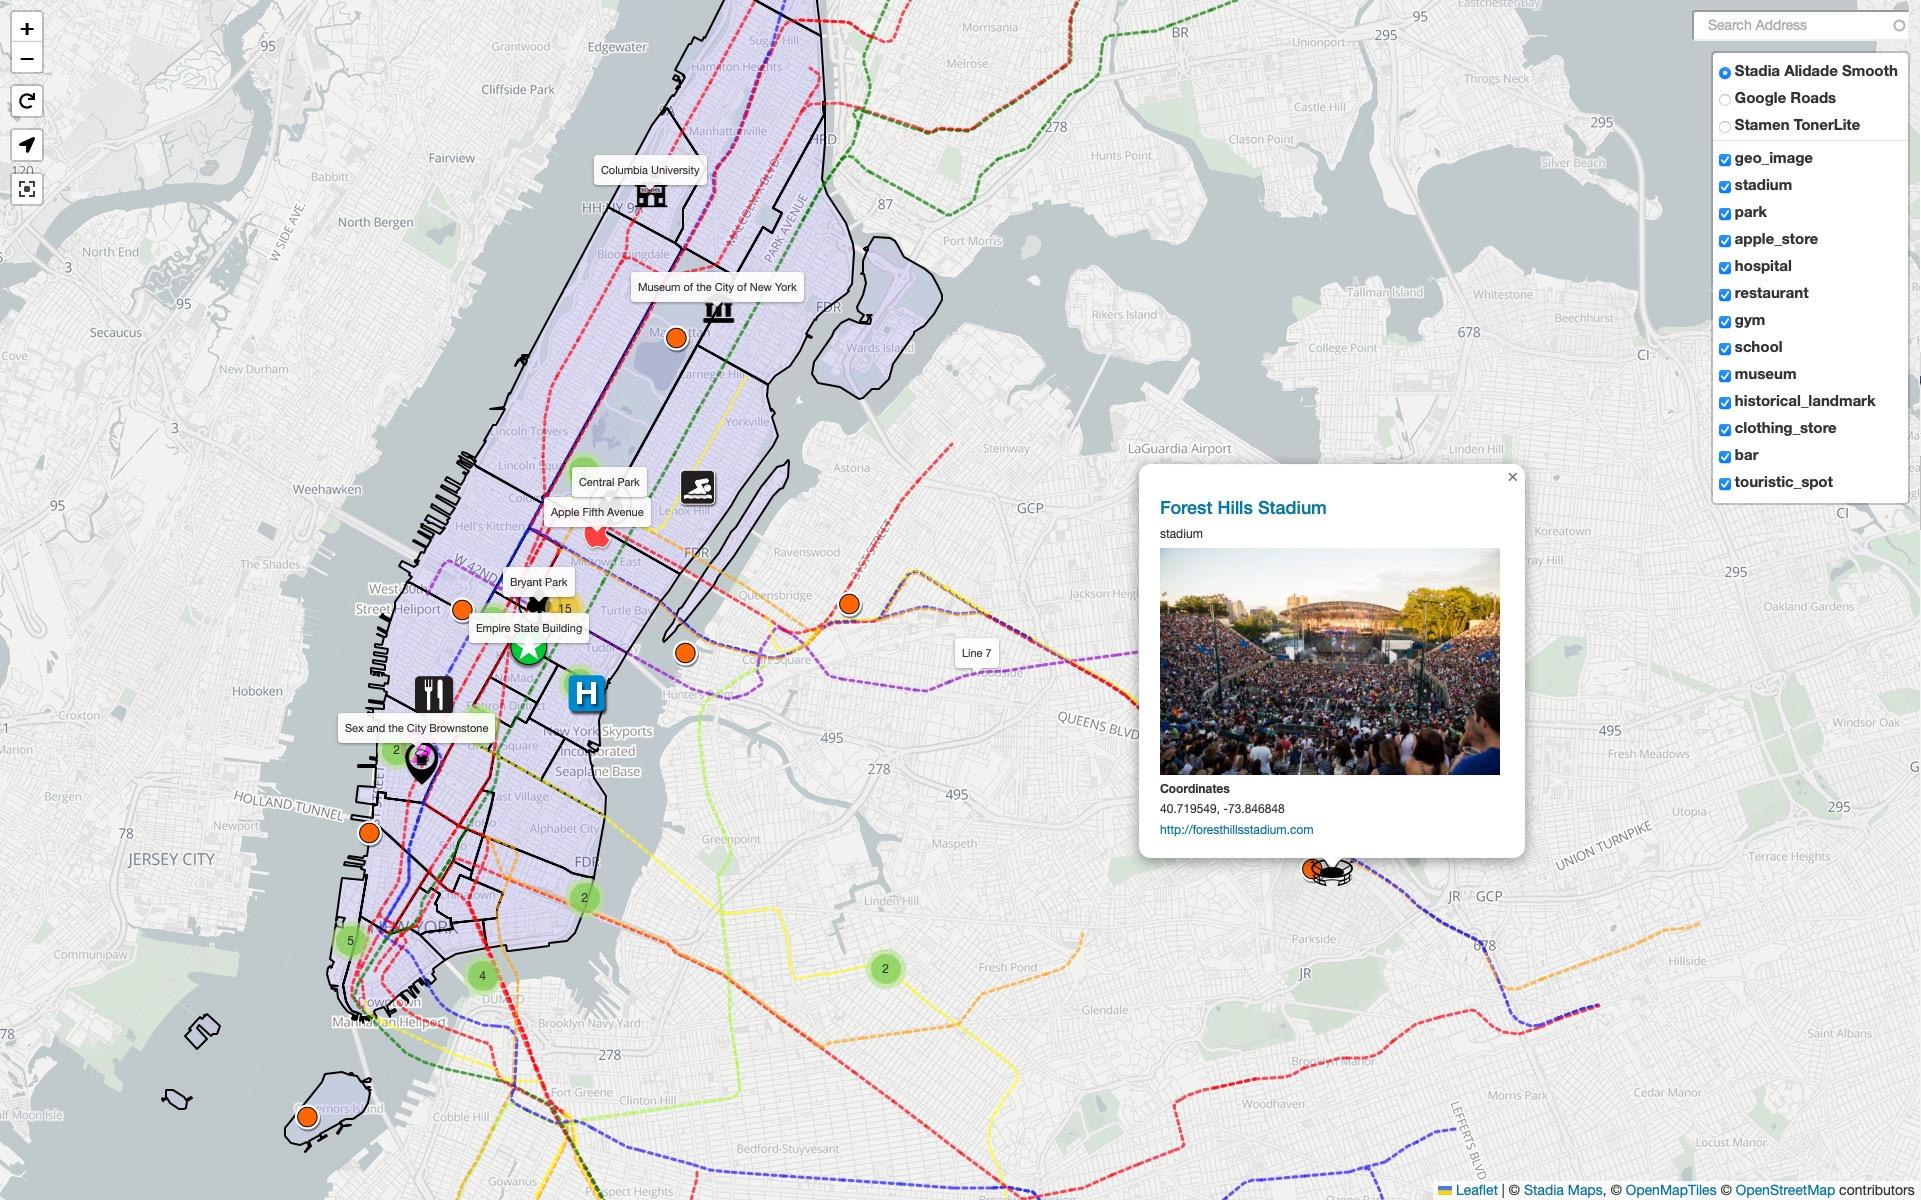
When it comes to enhancing user engagement on your website, nothing beats the effectiveness of interactive maps. Using Leaflet, a powerful open-source JavaScript library, you can create customizable mapping solutions that not only look great but also provide invaluable functionalities. With its lightweight design and ease of use, Leaflet is a go-to choice for developers and non-developers alike.
One of the standout features of Leaflet is its simplicity. You can quickly set up a basic map with just a few lines of code. Here’s a quick example to get you started:
This simple snippet will create a map centered over London, demonstrating just how easy it is to get started. But don’t let its simplicity fool you; Leaflet is packed with advanced features that let you customize your maps to fit your needs. Here are some of the capabilities you can leverage:
- Custom Markers: Add personalized icons to highlight specific locations.
- Layer Control: Enable users to switch between different data layers based on their preferences.
- Popups and Tooltips: Provide additional information about locations with engaging popups.
- GeoJSON Integration: Easily incorporate geographic data into your maps for dynamic visualizations.
In addition to these features, Leaflet supports a variety of plugins that can enhance your map’s functionality even further. For instance, you might want to integrate:
- Leaflet.draw: Add drawing tools for users to create their own annotations.
- Leaflet.markercluster: Manage large datasets by clustering markers to ensure a clean display.
- Leaflet.fullscreen: Allow users to expand the map to fullscreen for a more immersive experience.
Do you need a table to summarize the benefits of using Leaflet? Check this out:
| Features | Benefits |
|---|---|
| Lightweight | Fast loading times, minimal resource consumption. |
| Customizable | Tailor the map to your website’s theme and requirements. |
| Responsive Design | Adapts to various screen sizes for mobile and desktop. |
| Community Support | Vast resources and plugins available for extended functionality. |
Moreover, the integration process is straightforward. Leaflet allows you to fetch external data seamlessly, which means you can pull in data from APIs or databases to display dynamic content on your maps. This flexibility makes it an ideal solution for businesses that require real-time data representation.
Leaflet offers a powerful yet user-friendly platform for creating interactive maps. Whether you want to enhance an existing project or start from scratch, its rich feature set and customization options allow you to develop mapping solutions that truly resonate with your audience. So why not give it a try? You might just find that your website transforms into a more engaging and informative space.
Harnessing the Power of Mapbox for Stunning Visuals
Mapbox is a powerful platform that allows you to create stunning, interactive maps that can elevate any website. With its extensive customization options and high-quality visuals, you can engage your audience like never before. Let’s explore how to harness the capabilities of Mapbox to enhance your website’s interactivity and design.
One of the standout features of Mapbox is its flexibility in design. You can tailor every aspect of your map, from the colors and styles to the icons and markers. This means your map can seamlessly blend with your overall website theme, ensuring a cohesive user experience. Here are some design elements you can customize:
- Custom map styles: Choose from satellite imagery, terrain, or a street view to match your content.
- Layering options: Add multiple data layers to highlight specific information or themes relevant to your audience.
- Interactive elements: Enable pop-ups and tooltips that provide additional information when users click on markers.
Another key advantage of Mapbox is its data integration capabilities. Whether you’re working with geographical datasets or real-time information, Mapbox can help you visualize this data in a way that is both informative and appealing. You can easily integrate APIs to pull in dynamic data, making your maps not just pretty, but also useful. Consider these approaches:
- Real-time data feeds: Display live data such as weather, traffic, or social media feeds directly on your map.
- Geocoding features: Allow users to search for locations effortlessly, enhancing their interaction with the map.
- Custom markers: Use unique icons to represent different data points, making your map more intuitive.
For those looking to keep things simple, Mapbox also offers easy-to-use tools and libraries, such as Mapbox Studio and the Mapbox GL JS library. These tools make it straightforward for developers and non-developers alike to build interactive maps without extensive coding knowledge. Here’s a quick overview of how to get started:
| Tool | Description |
|---|---|
| Mapbox Studio | A user-friendly interface for designing custom maps visually. |
| Mapbox GL JS | A JavaScript library that allows for dynamic map rendering and interactions. |
| Mapbox SDKs | Mobile SDKs for integrating maps into iOS and Android applications. |
Lastly, don’t underestimate the community support and resources available for Mapbox users. The platform has an extensive library of documentation, tutorials, and community forums where you can find answers to your questions and inspiration for your projects. Engaging with this community can help you unlock the full potential of your maps, ensuring you’re always up to date with the latest features and best practices.
By leveraging the unique features of Mapbox, you can create interactive maps that not only captivate your users visually but also provide them with valuable information. Whether you’re showcasing a travel destination, displaying data trends, or guiding users to local businesses, the possibilities are endless. Dive into Mapbox, and transform your website into a more engaging and informative platform today!

Incorporating OpenStreetMap for a Free and Open Option
When it comes to creating interactive maps, many users are often intimidated by the cost and complexity associated with mainstream mapping services. However, there’s a refreshing alternative that is not only free but also encourages community participation: OpenStreetMap (OSM). This platform is built by users like you, making it a living map that evolves with contributions from around the globe.
One of the fantastic features of OSM is its open data model. This means that you can access and utilize OSM data without worrying about licensing fees or usage restrictions. Here’s why incorporating OpenStreetMap into your website can be a game-changer:
- Cost-Effective: Since OSM is completely free, you can allocate your budget to other critical areas of your project.
- Customization: You have the freedom to style the map according to your brand’s aesthetics, ensuring it integrates seamlessly with your site’s design.
- Community-Driven: OSM’s data is consistently updated by a global network of contributors, meaning your maps will reflect the most current information available.
- Rich Features: From routing to location markers, OSM provides a robust set of features that can enhance user interaction on your site.
Integrating OSM into your website is straightforward. Many JavaScript libraries, like Leaflet and Mapbox GL JS, allow you to render OSM data easily. These libraries provide a range of functionalities that let you create beautiful, interactive maps without the need for extensive coding knowledge. Here’s a simple example of how you can use Leaflet:
In addition to its flexibility and cost-effectiveness, OSM boasts a strong community support network. There are numerous forums, tutorials, and documentation available for those looking to dive deeper into map development. Engaging with this community can provide insights that you might not find elsewhere, enhancing your project even further.
Moreover, if you’re ever concerned about the quality of data, consider that OSM is often more detailed than proprietary maps in many areas. This is particularly beneficial for niche applications where unique local features are essential. By leveraging OSM data, you’re not just getting a map; you’re getting a comprehensive view of the world as seen by its users.
To summarize, OpenStreetMap stands out as a practical solution for anyone looking to create interactive maps for their website. Its wealth of features, coupled with the freedom to customize and the absence of costs, makes it an ideal choice for developers and businesses alike. With a bit of creativity and the right tools, you can create stunning, interactive maps that not only meet your needs but also engage your users like never before.
Enhancing User Experience with Map Features and Controls
When it comes to creating an interactive map for your website, enhancing user experience is paramount. Adding various features and controls can significantly improve how users interact with your map, making it not just a tool for navigation, but a part of the overall storytelling experience of your website.
First and foremost, consider integrating zoom controls. Offering users the ability to zoom in and out allows them to explore areas of interest more closely. This simple feature can transform a static map into an engaging journey, encouraging users to discover new locations or details they might otherwise overlook.
Another effective feature is marker clustering. If your map hosts numerous markers, clustering them can help prevent clutter. When users zoom out, markers combine into a single cluster, providing a cleaner view. As users zoom in, these clusters break apart to reveal individual markers. This not only enhances aesthetics but also improves navigation efficiency.
Incorporating filter options enables users to tailor their experience. For example, users could filter locations by category—restaurants, parks, or shopping areas. This customization empowers users to find exactly what they’re looking for quickly, enhancing their interaction with the map.
| Feature | Benefit |
|---|---|
| Zoom Controls | Encourages exploration of details |
| Marker Clustering | Reduces visual clutter |
| Filter Options | Enhances user customization |
| Search Functionality | Quick access to specific locations |
Don’t forget about search functionality. Implementing a search bar allows users to type in specific locations or addresses, facilitating a seamless experience. This feature is particularly crucial for users who may know exactly where they want to go but aren’t familiar with the surrounding areas.
Additionally, consider adding directions and routing options. By providing users with step-by-step directions from their current location to a destination on the map, you significantly enhance usability. This integration can be especially beneficial for businesses, helping customers find their way effortlessly.
Lastly, enhance the map’s visual appeal through customization. Use color schemes that align with your brand, or incorporate unique icons for different types of markers. A visually appealing map not only attracts users but also retains their interest, making them more likely to explore further.
Tips for Optimizing Your Interactive Map for Performance
Optimizing your interactive map for performance is essential to ensure a smooth user experience. Here are some effective tips that can help you achieve that:
- Reduce Map File Size: Compress images and resources used in your map. Tools like TinyPNG can significantly reduce image sizes without quality loss.
- Lazy Loading: Implement lazy loading techniques so that the map loads only when it enters the viewport. This reduces the initial load time and makes your website feel faster.
- Minimize API Calls: If your map relies on external APIs, batch requests whenever possible. This can cut down on the number of calls made and improve performance.
- Optimize Data Handling: Use efficient data structures and methods to handle your geographic data. For example, utilize geoJSON instead of heavier formats for better performance.
Another way to improve performance is through the careful use of map layers. Each layer adds complexity and can slow down rendering times. Consider the following:
- Limit the Number of Layers: Only display necessary layers. Too many layers can clutter your map and impact performance.
- Use Vector Tiles: Vector tiles are significantly smaller than raster tiles, allowing for faster loads and smoother interactions.
Browser caching is another powerful tool to enhance performance. When users revisit your site, cached resources can be loaded instantly. Implement caching strategies by:
- Setting Cache Headers: Use appropriate cache headers to inform the browser about resource expiration.
- Utilizing Service Workers: Employ service workers to cache dynamic content and assets for offline use, enhancing user experience.
consider the infrastructure behind your interactive map. A robust foundation can significantly impact performance:
| Infrastructure Component | Impact on Performance |
|---|---|
| CDN (Content Delivery Network) | Distributes content closer to users, reducing latency. |
| Server Location | Placing servers geographically closer to your audience improves load times. |
| Database Optimization | Efficient queries and indexing speed up data retrieval for map interactions. |
By implementing these strategies, you can create an interactive map that not only looks great but also performs exceptionally well. Happy mapping!

Best Practices for Mobile Responsiveness in Mapping
When it comes to creating interactive maps for your website, ensuring mobile responsiveness is crucial. A significant amount of web traffic comes from mobile devices, so your maps need to look good and function well on smaller screens. Here are some best practices to ensure your interactive maps are mobile-friendly.
- Use Fluid Layouts: Implement a fluid grid system that allows your maps to adjust according to the screen size. CSS frameworks like Bootstrap can be incredibly useful in creating a layout that adapts seamlessly.
- Optimize Touch Interactions: Since mobile users rely on touch, ensure that controls like zoom buttons and markers are large enough to be easily tapped. A minimum touch target size of 44×44 pixels is recommended.
- Limit Data Overload: Mobile screens have limited real estate, so avoid clutter. Display only essential information initially and provide options for users to explore more through pop-ups or expandable sections.
- Leverage Geolocation: Integrating geolocation features can significantly enhance the user experience. Allow users to quickly find their location and navigate your map accordingly.
Another key aspect is performance. A slow-loading map can frustrate users and lead to high bounce rates. Here are some additional tips:
- Compress Images: If your map includes images or icons, ensure they are optimized for fast loading. Use tools to compress images without losing quality.
- Use Asynchronous Loading: Implement asynchronous loading for map resources. This means your map will load in the background without delaying the display of other page elements.
- Test Across Devices: Always test your interactive map on various devices and screen sizes. Tools like Chrome DevTools can help simulate different environments, but real device testing is invaluable.
| Device Type | Key Considerations |
|---|---|
| Smartphones | Ensure tap targets are large; prioritize essential info. |
| Tablets | Utilize larger screen space; maintain touch-friendly interface. |
| Desktops | Provide detailed features but ensure responsiveness. |
By incorporating these practices, you can create interactive maps that not only engage users but also enhance their experience on mobile devices. A well-designed mobile-friendly map can keep your audience captivated and increase their interaction with your website.
Engaging Users with Interactive Overlays and Markers
To truly captivate your audience, integrating interactive overlays and markers into your map can elevate the user experience on your website. These features not only make your map visually appealing but also enhance functionality, directing users’ attention to significant locations or pieces of information.
Here’s how you can effectively engage users:
- Dynamic Markers: Utilize markers that change based on user interaction. For example, when a user hovers over a marker, it could expand to show more details or images related to that location. This encourages exploration and makes your map an engaging resource.
- Pop-up Overlays: Incorporating pop-up overlays that appear when users click on a marker can provide additional context. Use these overlays to share stories, images, or videos that relate to the point of interest, making the information more relatable and interesting.
- Custom Icons: Design unique icons for your markers that reflect your brand or theme of the map. This personalization not only enhances the aesthetic but also creates a sense of familiarity and belonging for your users.
- Interactive Filters: Enable users to filter the markers based on categories or types of locations. This feature allows them to focus on what matters most to them, whether it’s restaurants, historical sites, or parks.
To further illustrate the impact of these features, consider this simple table showcasing different interactive elements you can include:
| Feature | Description | User Benefits |
|---|---|---|
| Dynamic Markers | Markers that expand with information on hover | Encourages exploration and engagement |
| Pop-up Overlays | Additional context through clickable pop-ups | Enhances storytelling and user connection |
| Custom Icons | Branding through unique design of markers | Creates familiarity and strengthens brand identity |
| Interactive Filters | Options to sort markers by categories | Personalizes user experience and simplifies navigation |
By thoughtfully implementing these interactive elements, you can transform a standard map into a rich, immersive experience for your users. Encourage feedback to understand which features resonate most with your audience. This not only fosters a sense of community but can also guide future enhancements to your map.
Remember, the key is to make your map not just a tool for navigation, but a hub of interaction and engagement that keeps users coming back for more. So, roll up your sleeves and get started on creating an interactive map that captivates and retains your audience!
Promoting Your Interactive Map to Boost Traffic
Once you’ve created your interactive map, the next step is to ensure it reaches your intended audience. Promoting your map effectively can significantly boost traffic to your website. Below are some strategies to help you spread the word:
- Social Media Sharing: Use platforms like Facebook, Twitter, and Instagram to showcase your map. Create engaging posts that highlight unique features or interesting data points, encouraging users to check it out.
- Influencer Partnerships: Collaborate with influencers in your niche who can help promote your map. They can share it with their followers, amplifying your reach.
- Email Marketing: Send a dedicated email to your subscriber list featuring the map. Include visuals and a clear call-to-action, enticing readers to explore the interactive features.
- SEO Optimization: Ensure your map is search engine optimized. Use relevant keywords in your alt tags, descriptions, and titles to improve visibility in search results.
Additionally, consider creating content around your interactive map. Blog posts that delve into the data, user guides, or case studies can all enhance your marketing efforts. These posts not only provide context but also encourage backlinks, improving your SEO.
Another effective method is to engage with online communities. Share your map in relevant forums, discussion groups, or on platforms like Reddit and Quora. By providing value and context, you can draw interested users to your site.
Lastly, don’t underestimate the power of user-generated content. Encourage visitors to share their own experiences using the map. You can create a specific hashtag or feature user stories on your blog or social media. This not only builds community but also increases your map’s visibility.
| Promotion Method | Benefits |
|---|---|
| Social Media Sharing | Wide reach and engagement |
| Influencer Partnerships | Access to new audiences |
| Email Marketing | Targeted audience engagement |
| SEO Optimization | Increased visibility |
By implementing these strategies, you can effectively promote your interactive map and drive more traffic to your website. The key is to be consistent and creative in your approach, making sure to engage with your audience throughout the process.
Analyzing User Interaction to Improve Map Functionality
Understanding how users interact with your map is essential for enhancing its functionality. By analyzing user behavior, you can identify pain points, improve usability, and create an engaging experience that meets the needs of your audience. Here are some strategies to consider:
- Heatmaps: Utilize heatmaps to visualize where users click most frequently. This data helps you understand which areas of the map attract the most attention.
- Session Recordings: Implement tools that record user sessions. Watching how users navigate your map can reveal common frustrations or misunderstandings.
- Surveys and Feedback: Incorporate quick surveys or feedback forms within the map interface. Asking users for their opinions directly can yield valuable insights.
- Analytics Integration: Use analytics tools to track user engagement metrics. Metrics such as time spent on the map and bounce rates can inform you about its effectiveness.
After gathering data, the next step is to interpret it effectively. Look for trends in user behavior that indicate whether your map meets their expectations. For example, if a significant number of users are abandoning the map at a particular point, it may signal that the information is unclear or the interface is confusing.
Furthermore, consider the context in which users are interacting with your map. Are they using mobile devices or desktops? Understanding the platforms your audience prefers can help you optimize the map’s design for better accessibility and functionality across different devices.
| Device Type | User Engagement Rate |
|---|---|
| Mobile | 65% |
| Desktop | 35% |
Another crucial aspect of enhancing map functionality is personalization. Users appreciate interactive features that cater to their specific interests. By analyzing data on user preferences, you can offer tailored content, such as customized map markers or suggested routes based on past behavior.
Lastly, don’t underestimate the importance of regular updates based on user feedback. Continuous improvement not only enhances user satisfaction but also keeps your map relevant in a dynamic environment. By fostering a cycle of feedback and adaptation, you’re ensuring that your map evolves alongside user needs and technological advancements.
Final Thoughts on Creating Your Perfect Interactive Map
Creating an interactive map for your website can be a game-changer in how your audience engages with your content. While the methods may vary, the touch of creativity and attention to detail you bring to the project will set your map apart from the rest. Here are some final thoughts to consider as you embark on this exciting journey:
- Know Your Audience: Understanding who will use your map is crucial. Tailor the design and functionality to meet their needs. Are they tourists looking for attractions, or are they researchers needing data? This knowledge will guide your choices.
- Keep It Simple: The best interactive maps often have a clean, intuitive layout. Avoid cluttering the interface with excessive buttons or information; instead, focus on clarity and ease of use.
- Utilize Data Wisely: If your map includes layers of data, ensure they add value. Consider using color coding or icons that are easy to understand at a glance. Engaging visuals can make complex data more digestible.
- Mobile Responsiveness: In today’s world, many users will access your map on mobile devices. Ensure your design is responsive, providing a seamless experience for every user, regardless of the device they choose.
Another important aspect is the integration of interactive elements. Features like pop-ups, tooltips, and clickable regions can enhance user experience significantly. Think about how you can make the map not just a tool for navigation, but a dynamic resource that tells a story or provides insights.
Consider the use of visual storytelling. Maps can convey rich narratives by linking locations to relevant content such as images, videos, or articles. This contextual information helps foster a deeper connection between users and the locations depicted in your map.
Lastly, don’t forget about user feedback. Once your map is live, monitor how users interact with it and be open to suggestions. Tools like Google Analytics can provide insights into popular features and areas that may need improvement. Iteration is key to refining your map and ensuring it meets your audience’s evolving needs.
| Tip | Description |
|---|---|
| Engagement | Make your map engaging with interactive features. |
| Accessibility | Ensure your map is accessible to all users. |
| Performance | Optimize loading times for a smooth experience. |
| Testing | Conduct usability testing to identify issues. |
By focusing on these elements, you can create an interactive map that not only serves its purpose but also delights users and enriches their experience on your website. The journey to a perfect interactive map may seem daunting, but with thoughtful planning and creativity, you can craft a tool that informs, engages, and inspires.
Frequently Asked Questions (FAQ)
Q: Why should I create an interactive map for my website?
A: Great question! An interactive map can significantly enhance user engagement on your website. It not only helps visitors easily find locations or information but also makes your content more visually appealing. Plus, it can improve the overall user experience, keeping visitors on your site longer and encouraging them to explore more.
Q: What are the easy methods I can use to create an interactive map?
A: There are several methods to create an interactive map, but here are four of the easiest ones:
- Google Maps Embed: This method is super user-friendly! You can simply generate a map from Google Maps, customize it, and embed it into your website with a code snippet. No coding skills required!
- Mapbox: If you want more customization and a unique design, Mapbox is a fantastic tool. It allows you to create highly interactive maps with customizable styles and features, perfect for adding your branding.
- Leaflet.js: For those who have a bit of coding knowledge, Leaflet.js is a lightweight JavaScript library that enables you to create mobile-friendly interactive maps. It’s open-source, which means it’s free to use, and offers great flexibility.
- ArcGIS Online: If you’re looking for something robust and feature-rich, ArcGIS Online lets you create detailed maps with various data layers. It’s ideal for organizations that need to showcase geographic data professionally.
Q: Do I need technical skills to create an interactive map?
A: Not necessarily! Many of the methods we discussed, like Google Maps Embed, require little to no technical skills. However, if you want to dive into more advanced options like Leaflet.js, having a basic understanding of JavaScript will be helpful. Don’t let a lack of technical know-how hold you back – there are plenty of user-friendly tools that make the process a breeze!
Q: Can I customize the interactive map to match my website’s branding?
A: Absolutely! Customization is one of the perks of using tools like Mapbox or Leaflet.js. You can change colors, add markers, and even integrate your logo. This ensures that your map seamlessly fits your website’s aesthetic and enhances your brand identity.
Q: What types of websites benefit most from interactive maps?
A: Interactive maps can benefit a wide range of websites! They’re great for real estate sites showing property locations, educational platforms displaying geographic data, tourism websites guiding visitors to attractions, and even e-commerce sites highlighting store locations. If location is essential to your content, an interactive map is a must-have!
Q: Is it worth the time and effort to create an interactive map for my website?
A: Definitely! Investing time in an interactive map can pay off in spades. It not only improves user experience but can also boost your website’s SEO and keep visitors coming back. In a world where first impressions matter, having an engaging and functional map can set you apart from the competition. So, why wait? Start exploring the methods today!
Wrapping Up
And there you have it! Creating an interactive map for your website doesn’t have to be a daunting task. With these four easy methods, you can add a dynamic and engaging element that enhances user experience and keeps your visitors coming back for more. Whether you choose to use Google Maps, Mapbox, Leaflet, or custom solutions, each option has its unique perks that can cater to your specific needs.
Now it’s your turn to take the leap! Imagine the possibilities — guiding users through your content, showcasing locations, or providing a visual journey that makes your site stand out. The power of interactivity is at your fingertips, ready to elevate your website to the next level.
So, roll up your sleeves, pick the method that resonates with you, and start building that killer interactive map. Your audience will thank you, and you’ll be one step closer to creating a truly immersive experience. If you have any questions or need some tips along the way, don’t hesitate to reach out. Happy mapping!